The Blitzkrieg saga ended in early December 1941 thanks to the inability of meteorology.
Amended: Nov.21, 2021; Original post (23 April 21) below.
When Adolf Hitler attacked Russia on 22 June 1941 (Frontline strength, 3.8 million personnel), he believed that the highly successful Blitzkrieg strategy during the first two war years would also be sufficient to conquer Russia. But just five months later, the concept ended in ice and snow between Warsaw and Moscow. Such a weather situation had not existed for over 150 years and meteorologists had predicted the opposite. The reason: after the two winters in Europe 1939/40 and 1941/42 were extremely cold and snowy, a third extreme winter in a row was ruled out. This has never happened since there were weather records. The forecast turned out to be catastrophic, but on the other hand revealed incompetence in metrology, which turned out to be a blessing for the course of the war. Hitler and the German Army got their Waterloo and the end of the earlier blitzkrieg successes.
To understand the drama, one only has to look at the weather and temperature maps between Warsaw and Moscow for late November and early December. These are around the freezing point, then as now. That was different in late autumn 1941. On December 9, 1941, the NYT reported: “Nazis give up Idea of Moscow in 1941, as winter has stopped the Germans short of Moscow”, which a spokesman for the High Command explained that “The cold is so terrific that even the oil freezes in motorized vehicles. Soldier and officers trying to take cover simply freeze to the ground “. This unusual weather situation had been brewing since the beginning of November. After a wet autumn, severe frost set in unusually early. It was one of the earliest and severest since observation had been recorded.
The extraordinary situation is reflected by two sources: The German Field Marshal von Bock, commander of Army Group Center, recorded in his war diary on 5 November 1941 that the mercury dipped to -29°C (-20°F), and Albert Seaton reported that around 24 November it was a steady -30°C (-22°F). Even the Russian the Meteorological Service records of the minimum temperatures for the Moscow area in late 1941: October, -8.2°C (about +17°F); November, -17.3°C (+1°F); December, -28.8°C (-20°F). On 30 November the already mentioned Marshall von Bock informed the Chief of Staff of the German Army, that his men face temperatures down to -45°C (-49°F). Exaggerated or not, the winter came much too early and exceeded all expectations. The misery continued to last, enhanced by heavy snow and snow drifts. The Blitzkrieg versus Russia ended already in early December 1941, and marked the beginning of the end of Adolf Hitler’s great power aspirations.
It is embarrassing that this turning point can be traced back to incompetent meteorologists, and that even 80 years later, climate science has nothing to say about it and is silent. After all, two extreme war winters had preceded and had the involved meteorologists inquired about their causes, namely the naval war in the North and Baltic Seas and all other European waters, a false prognosis would have been avoidable. The false and incompetent prognosis had a pronounced impact on the length and outcome of World War II, and is to be judged as an unique stroke of luck. However, that the reasons for this failure, has not been explored to this day, means a severe failure in climatology. This is explained as it follows.
Not naming the 1st climate criminal is
very damaging to the climate debate
Post April 23, 2021
Adolf Hitler who governed the “Third German Reich” from 1933 to 1945 and started the Second World War (WWII) on 1st September 1939, deserve the most pitiful titles, which can be attributed to an individual person, from war criminal to Holocaust mass murderer. This should comprise calling him to be the first climate criminal. Assigning Hitler the designation as a climate criminal could already be determined after the first three years of the war. All that was needed was to take the published observations of A.J. Drummond seriously in 1943 and investigate the case. The decisive findings are as follows:
“The present century has been marked by such a widespread tendency towards mild winters that the ‘old-fashioned winters’, of which one had heard so much, seemed to have gone forever”.
The sudden arrival at the end of 1939 of what was to be the beginning of a series of cold winters was therefore all the more surprising. (underline added)
“Never since the winters of 1878/79, 1879/80 and 1880/81 have there been in succession three so severe winters as those of 1939/40, 1940/41 and 1941/42.”
“Since comparable records began in 1871, the only other three successive winters as snowy as the recent ones (1939/40, 1940/41 1941/42) were those during the last war, namely 1915/16, 1916/17 and 1917/18…”. , (Quarterly Journal of Royal Met. Soc., 1943, details see Ref. at the end).
The correlation between war and climate change is very evident. The above mentioned observation by Drummond were enhanced by further approaches, which could have been used to stamp Hitler as a climate criminal, but many other analyzes were carried out and published before the end of WWII. The material was so numerous and clear that a conviction of Adolf Hitler as a climate criminal would have been swiftly possible. That did not happen and was never considered by science. A tragedy! The climate discussion that has been going on for several decades would have been different. That could still happen today, if the scientific community studies the climate changes during the first years of the WWII and describes Hitler as responsible for the changes, as they were described by Drummond (see above).The overall result would clearly demonstrate, that the climatic shifts after the 1st and 2nd World War was the result of the war at sea. (More about this: HERE)
From an abstract point of view, Hitler started the biggest climate experiment with World War II and he was very successful with it. The overall result of WWII was a global cooling since the winter of 1939/40, which lasted over three decades, which can be determined from countless weather deviations and trend changes over six years of the war. The physical force behind it was naval warfare in European waters, in the North Atlantic and Pacific. (ditto: as previous link) But the sciences in the disciplines of meteorology and climatology know nothing about it and are not interested in it. In addition to the evil actions of Hitler, we have been dealing with an incompetent science for many decades, unable to recognize and evaluate the greatest historical climate experiment. The climate discussion would not take place as it has been taking place for a long time. It is a drama of unknown proportions.
One has to go back a long way about Hitler’s great climate experiment, because that is not possible with just a few sentences. From many essays and books, the following is a brief overview about the first three war winters .
Autumn Weather 1939 in Europe
The war began on September 1st, 1939. In the following three months of weather, dozens of weather deviations from normal occurred, which results in much evidence of man-made weather. The deviations were the result of war activities at sea alone or in combination with war activities on land, or in the air. From the countless freak weather up to December 1939, only a few can be briefly mentioned here.
On September 1st, 1939, the German Wehrmacht attacked Poland with more than two million soldiers and many thousands of tanks (5000+), airplanes (3500+) and guns (5000+). The Polish Army, less than half as strong as the German, had to surrender after a few weeks. One reason was that Poland waited desperately for rain, to stop the German advances in muddy roads and water soaked ground. In vain, they got only a drizzle, reported the NYT (Sept. 17, 1939).
Instead the rain fell abundantly, up to 300% above the usual mean, from London to Basel until the end of November. The military deployment on the French and German armies along the Rhine was well in several millions. Surveillance, transport, training, but also combat missions determined the days. This also applies to all European coastal seas, especially the North and Baltic Seas, where more than 1000 warships operated from September 1, onwards.
A large number of unusual weather shifts could be observed, like the very pronounced change in rain pattern, while other changes would require too much space to be explained here. One image indicates the change of wind-direction in Northern Europe, in this case for the city of Hamburg.
Ice-Age winter 1939/40
The winter started in early December 1939 and quickly proved being as cold as the last Little Ice Age (LIA) winters before 1850. From Amsterdam to Moscow many all-time minus records happened, for entire Poland with minus 41°C on January 11, 1940. The New York Times provided excellent information, including reporting on a speech by Adolf Hitler’s deputy, Field Marshal Herman Göring, addressing the LIA condition (NYT, Feb.16)::
· “Nature is still more powerful than man. I can fight man but I cannot fight nature when I lack the means to carry out such a battle. We did not ask for ice, snow and cold – a higher power sent it to us” and “These troubles, naturally, take precedence over yours. They are not a German patent – look at the nations around that have the same difficulties.”
Herman Göring was wrong. The war mongers in Germany were to blame. Particularly the naval war had brought this winter about. Göring was as much a climate-criminal as Hitler. Although this would be not so difficult to establish, the world of science is silent. A detailed assessment of war-winter 1939/40 – HERE.
Extreme winter 1940/41
One of the most remarkable aspects of the winter 1940/41, is that this winter ranks only in third place of the three war winters in question, except in the Skagerrak region where it climbed to the 2nd rank. The high ranking can be linked to naval operation by the German Navy to conquer Norway since April 1940. Norwegians defended their country with shore batteries, sea mines, and surface vessels. Britain and other nations contributed to their defence. During the remaining months until the record cold January 1941, German and Allied naval forces met in numerous encounters along the entire Norwegian coast up to the Barents Sea.
The slightly lower severity of the winter 1940/41 is a logical consequence of the fact, that the Baltic was not used as a battle ground as during winter 1939/40 and 1941/42, but was left ‘undisturbed’ by major military operation since the armistice between Finland and Russia in March 1940. The difference between little naval activities and a lot was obvious during the next winter.
The impossible happened – winter 1941/42
Meteorology considered as impossible that after two of the extremes winters observed a third could follow. The chief adviser to Hitler, Franz Baur (1887-1977) did exactly this with the words: “Since in the history of the weather there have never been more than two severe winters in succession, the coming winter season of 1941/42 will be normal or mild”. The exact opposite happened. This winter was the beginning of the end of the German army in ice and snow deep in Russia. In late summer she had invaded Russia. The Baltic Sea had been made into a battle-field for the two navies, which contributed significantly to the extreme weather conditions. To cut a long story short, here is what the NYT reported already in early December 1941: “Nazis give up idea of Moscow in 1941. Winter forces abandoning big drives in the north until spring, Berlin says” (NYT, Dec. 09, 1941). Temperature and snow conditions became worse than the wildest imagination, lasting until spring. What is not known is that Hitler could only blame himself and his advisors for this enormous miscalculation. They had expected a mild winter. They had not learned anything from the previous two cold winters, and the role that naval war had played. Now the adverse had happened. The ‘great commander’, according to his own assessment, had shot himself in the foot. Thank heavens. The abandonment of the big drive in early December 1941 already marked the beginning of the end of the Third Reich, which unfortunately lasted until 1945.
Neither Franz Bauer ever asked himself, why his prediction went so desperately wrong. This fault discredits him as serious scientists, but his colleagues as well, because the winter was man made and the general public has a right to know.
The big exception – 3 extreme winters in row
For further indication of the big exception of three extreme winters in a few figures have been added. There a abundantly examples available. Here is what L.F. Lewis, a colleague of Drummond published in a paper 1943 (see Ref. below), titled: “Snow-Cover in the British Isles in January and February of the Severe Winters of 1940, 1941, and 1942.” Lewis made two interesting statements:
“The three consecutive winters of 1940, 1941 and 1942 were, however, unusually severe; the snow was considerable and the number of days of snow-laying comparatively large”.
“Three such severe winters in succession as 1940, 1941 and 1942 appear without precedent in the British Isles for at least 60 years, a similar one occurring from 1879-1881“
Lewis mentions that his investigation is based on approximately 300 stations in Great Britain alone. He explains the situation by a map, “Days with snow-lying”. For details see: sub-section “Snow cover and durations” HERE
Conclusion: Hitler and the climate-debate
Of course, the question is justified whether it still makes sense today to declare Hitler an idiot (see: Jayden Yugie, MEDIUM, Dec.19/2020) or a diverse criminal. When it comes to the climate issue, one should by no means do without it. The more clearly this would be recognized and expressed, the more the climate debate would shift. The currently big topic about the greenhouse effect would be different. As long as this is not definitely clarified, one must accuse climate research of massive failure. Naval war as a serious climate change factor cannot remain an unanswered question.
If people and governments would know why Hitler had to be named the first climate criminal, the climate debate would not proceed as it has been for decades.
Drummond, A. J.; (1943); “Cold winters at Kew Observatory, 1783-1942”; Quarterly Journal of Royal Met. Soc., No. 69, pp. 17-32, and ibid; Discussion: “Cold winters at Kew Observatory, 1783-1942”; Quarterly Journal of Royal Met. Soc., 1943, p. 147ff.
Lewis, Lilian, F. (1943); “Snow-cover in the British Isles in January and February of the severe winters 1940, 1941 and 1942”, Quarterly Journal of Royal Met. Soc., p. 215-219.
Cause big volcanic eruptions a warmer or colder world? The lid over oceans!
Post:: April 12, 2021
A volcanic eruption in Iceland hit the headlines a few weeks ago. After a break of 800 years, another volcano erupted on Reykjanes peninsula, just 20 miles south of Reykjavik, on 19th March 2021, at 20:45h. The event was spectacular but had no major impact.
Yesterday, April 10 2021, an explosive eruption has rocked La Soufriere volcano on the eastern Caribbean island of St. Vincent. The first explosion shot an ash column 10 kilometers into the sky and that the majority of the ash was headed northeast into the Atlantic Ocean. That occurred four days short of the 42nd anniversary of the last sizable eruption, in 1979, and a previous eruption in 1902 killed some 1,600 people. Meanwhile on April 11, about 16,000 people have had to flee their ash-covered communities. Experts warn that the explosions could continue for days or even weeks, and that the worst could be yet to come. The latest news report reads: Fri, 23 Apr 2021 : Soufrière St. Vincent volcano vigorous eruption yesterday
Few weeks ago we run the story at this site:“A volcanic eruption near Reykjavik has begun! Is the world prepared for a great eruption like Krakatoa? ” Today the question is what will happen after a big volcano eruption? It seems that science is not yet prepared to provide a reliable answer. Will it get warmer or colder? The general saying goes: Volcanic eruptions cause COOLING!
Here is at first an opposite view from Zambri et al. 2017, (Excerpts from Abstract): Observations show that all recent large tropical volcanic eruptions (1850 to Present) were followed by surface winter warming in the first Northern Hemisphere (NH) winter after the eruption. Recent studies show that climate models produce a surface winter warming response in the first winter after the largest eruptions but require a large ensemble of simulations to see significant changes. It is also generally required that the eruption be very large, and only two such eruptions occurred in the historical period: Krakatau in 1883 and Pinatubo in 1991. …..Though the results depend on both the individual models and the forcing data set used, we have found that models produce a surface winter warming signal in the first winter after large volcanic eruptions, with higher temperatures over NH continents and a stronger polar vortex in the lower stratosphere. (cont.)
Dr. Brian Zambri et al., seem not o have cared a lot about observed details. The forceful eruption of Krakatoa, August 26-27th, 1883, was also the first scientifically well recorded and studied eruption of a volcano, from the very beginning to its disastrous ending. The magazine NATURE covered the event extensively. The eruption of Krakatoa, darkened the sky worldwide for years afterwards. The final explosive eruption was heard 4,830 km (3,000 miles) away, 20 million tons of sulfur released into the atmosphere; produced a volcanic winter, reducing worldwide temperatures by an average of 1.2 °C (2.2 °F) for five years. Weather patterns were chaotic for years, and temperatures did not return to normal until 1888 (Wikipedia).
Critical view by Willis Eschenbach
Willis Eschenbach dealt with the investigation of B. Zambri et al., much more critically (WUWT, 2017) by stating, among other things, that In short, their claim that “Observations show that all recent large tropical volcanic eruptions (1850-present) were followed by surface winter warming in the first Northern Hemisphere (NH) winter after the eruption” is not supported by the evidence. And evidently, according to them, the other volcanoes are not large enough to lead to warmer winters …
Now if they actually were serious scientists, they would have noted that large volcanic eruptions are NOT followed by statistically significantly warmer winters, and they would have looked at something else. But these are not serious scientists, they are climate model believers. So instead they reached for a climate model, one of the models which are known to exaggerate the effects of volcanoes.
………
Finally, we’ve been told for years that volcanic eruptions cause COOLING … although what cooling is visible in the historical record is generally local, small, and short-lasting. But now, they say eruptions cause Northern Hemisphere winter warming? What’s up with that?
Andy May (2018) on “The effect of volcanoes on climate and climate on volcanoes”
In a longer essay A. May covers a longer time period including Tambora (1815) and Krakatoa (1883). From a number of conclusions, two read as follows:
(a) The idea that volcanoes affected climate by causing cooling on a temporal scale of less than a decade was an old one, already reported in 1940, and in the early 1970’s there was speculation that volcanoes could be a cause for glaciations. Presumably the effect of volcanoes on climate was limited.
(b) The Holocene Climatic Optimum and the Little Ice Age are not differentiated by their CO2 levels that were about the same, while volcanic activity was much higher during the HCO. What separates them is their different solar irradiation from both orbital changes and solar activity. The solar-LIA remains the only hypothesis supported by evidence, even if we do not understand well the climatic response to reduced solar activity.
Too much superficial talk! Krakatoa offers more insight!
It cannot be seriously questioned that a large volcanic eruption, with long-lasting sun shading by circulating ash, will have a lasting effect on global temperatures. After the outbreak of Krakatoa, it was quickly determined that the amount of solar energy received was clearly reduced for a period of several years, little attention was paid to the development of the atmospheric temperature. The blockage must have fluctuated strongly and have varied greatly, depending on the observation point. In total, the blockage effect has been calculated at an average of approximately 10% over a span of four years, whereby the reduction of solar energy in the northern hemisphere (Paris) was at its greatest in fall of 1885, reaching a value of 25%.(From Essay 1992: MORE HERE)
Now what about the question: warming or cooling? The answer is simple. There is at first a warming for some months, a few years, depending on the location in question. Close to the oceans the temperatures rise or drop will be moderate. Distant areas will get colder condition, and the average is going to drop pounced the longer the ashes block out sun ray. After few years also coastal region will feel the change. The severity of this process depends on the ocean and their heat capacity. The fairly short duration of Krakatoa’s ashes in the air reduced the impact on the just emerging industrialization. A comparable event today would push civilization toward an unimaginable global catastrophe.
Krakatoa ashes had popped a lid over oceans
This could be dismissed as coincidence if the time until 1886 had not been accompanied by another phenomenon, a “hazy fog”, a strange, smoky cloudiness in the atmosphere which was observed both in the tropics and in other areas. The hazy fog appeared as a constant companion of the extraordinary optical phenomena in the atmosphere during the entire period of the atmospheric-optical disturbance. One can say – speaking non-technically – that Nature had “popped a lid over it” and so protected the oceans from cooling off too quickly. The lid consisted of ingredients provided by Krakatoa and water vapor provided by the ocean. As a result of the “dirtying” of the atmosphere by the volcano’s eruption, the atmosphere displayed characteristics and behavior deviating from the norm. Just as fog over a water surface sharply limits the transfer of heat energy, the hazy fog must have had a long-lasting effect.
A unique climatic event, Krakatoa, was offered to science for their better understanding of big volcano eruption. Hopefully the more recent eruptions remain modest, and the next serious one is far away.
Is the world prepared for a great eruption like Krakatoa?
Post: March 20, 2021, Up-dates at the end of text, LAST May 06, 1st image
On 19th March 2021, at 20:45h UTC, reported the Icelandic Met Office, https://en.vedur
QUOTE At around 20:45 UTC today, 19 March, a volcanic eruption began at Geldingadalur, close to Fagradalsfjall on the Reykjanes Peninsula. The eruption was first seen on a web camera positioned close the mountain. It was also confirmed on thermal satellite imagery. At the time of writing, the weather on the peninsula is wet and windy, and an orange glow can be seen in low clouds on the horizon from Reykjanesbær and Grindavík. The eruption site is in a valley, about 4.7 km inland from the southern coast of the peninsula. The coastal town of Grindavík is the closed populated region to the eruption site, located approximately 10 km to the southwest.
Earthquake activity in the region of the magma intrusion has been lower in recent days, and there is presently no intense seismicity occurring in the region. Earlier in the day, several low-frequency earthquakes were recorded below Fagradalsfjall. There are presently no reports of ash fall, although tephra and gas emissions are to be expected. In line with well-rehearsed contingency plans, the aviation colour code for the Reykjanes Peninsula has been elevated to red, signifying an eruption in progress. Additional domestic restrictions have been put in place, including the closure of Reykjanesbraut – the main road from the capital region to Reykjanesbær and the international airport at Keflavík. UNQUOTE
Above: FewFilm Clips: On volcanic eruption, 19-21 March 2021 at Geldingadalur, close to Fagradalsfjall on the Reykjanes Peninsul, about 30 km south-west of Reykjavik
The Icelandic Met Office assumes that the volcanic activity could occur near Fagradalsfjall, 20 miles south of Reykjavik, or near the Keilir mountain close by. That would be the first in the region in 800 years, which spanned from the 11th to the 13th century. Now again the alert is high and the concern modest. Iceland’s scientists have a lot of experience, as there are 30 active volcanoes on the island. Presumably there will be an effusive eruption, rather than explosive, is the likely option it is said, and it looks like we are on time. Is the world prepared for a major volcano eruption in the Northern Hemisphere?
One decade ago Icelandic volcanic activities had already been in the news. The ash from the Vulcan Eyjafjallajökull on Iceland, during the days 14–20 April 2010, covered large areas of Northern Europe. About 20 countries closed their airspace to commercial jet traffic and it affected approximately 10 million travelers. The next eruption to come is easier to pronounce, but its impact a wide open question.. Iceland that usually records 1’000 tremors in a whole year, observed more than are 40’000 during the last few weeks. Few quakes were as strong as magnitudes of 5.7., on the volcanic explosivity index. On 19th March 2021a volcanic eruption near Reykjavik has begun! Whether the impact will be wider or less than the Eyjafjallajökull just a decade ago, remains to be seen. If it happens to reaches the impact comparable to the last major volcano eruption Krakatoa in August 1883, the damage to global civilization would be immeasurable, maybe few dozen times more serious than Covid-19. We talk on climate change but only concerning warming, not about a cooling, or a sky full of ashes.. The last serious volcano incident happened 128 years ago, but its impact seems forgotten and ignored by the people, the politicians and science. Climate scientists warn about global warming, but seem blind about a case which reduces the sun-ray reaching the earth surface over few years. By a similar incident the impact on the modern industrialized world be unimaginable destructive. But the talk is only about global warming, with nowhere a Plan B in sight.
Krakatoa’s climatic impact is still not well understood , and no Plan B prepared!
The forceful eruption of Krakatoa, August 26-27th, 1883, darkened the sky worldwide for years afterwards. The final explosive eruption was heard 4,830 km (3,000 miles) away, 20 million tons of sulfur released into the atmosphere; produced a volcanic winter, reducing worldwide temperatures by an average of 1.2 °C (2.2 °F) for five years. Weather patterns were chaotic for years, and temperatures did not return to normal until 1888 (Wikipedia). A unique climatic event was offered to science for their better understanding. Did they used the opportunity?
Immediately a worldwide observation and research commenced in an unprecedented scale. “The year 1883 will take a remarkable place in the history of earth with respect to the effects of the earth’s interior on the crust and everything found upon it,” wrote Neumayer in January 1884. Unfortunately it didn’t happen. More than 130 years later the Krakatoa matter is insufficiently understood and explained. For example a recent research by Zambri et al. 2017 claim, that “Observations show that all recent large tropical volcanic eruptions (1850-present) were followed by surface winter warming in the first Northern Hemisphere (NH) winter after the eruption”. Even worse argues Willis Eschenbach (WUWT) saying “Krakatau, largest eruption in recent history, shows almost no effect on the winter. It’s just about average”. The use of statistics in this way is frightening.
Both views are shaky, if not outright misleading, and in any case of no help. Both views ignore that only a detailed assessment of temperature variations in different regions may reveal a picture, which offers valuable clues for climate research and understanding. Observing a pronounced difference between continental inland areas and close-to-the-ocean areas, would inevitable quickly highlight the significant role the oceans have played in the aftermath of the eruption of Krakatoa. An essay from 1992, explained it in detail as it follows:
In the year following the three volcanic eruptions in 1883, including Krakatoa in August 1883, the circulation in the atmosphere was above normal and then sank to a powerfully developed minimum in 1888, wrote Artur Wagner in his discussion of climatic change in 1940[37]. At the most, a reduction in solar energy could be caused only by fine dust at high altitudes. Other authors also refer to Krakatoa only from the standpoints of blockage of sunlight and as a cause of ice ages[38]. Even today, the discussion of large-scale volcanic eruptions is limited to the determination that it can become colder for a short period of time[39]. Little is left of Neumayer’s euphoria of January 1884 and – as it appears – there have hardly been any advances for science. Did Krakatoa really leave behind so few traces, or were they simply not recognized?
b) The Observations after Krakatoa and the Stabilizer
Only a short time after the main eruption of Krakatoa on 21 August, 1883, unusual observations were reported, which were compiled by Neumayer[40].
Here are some examples from ship logs from all over the world in 1883:
3 September: During the past few days, there has been a fairly even gray cloud mass, normally covering the entire sky, above the cumulus and stratus clouds;
3 September: At midday hazy gray air. Hazy, gray air condensing into dew towards evening;
5 September The air appears yellow and watery;
7 September: The atmosphere appeared to be filled with very small, evenly distributed clouds of vapor;
13 September: The yellowish “haze” continues in the upper atmosphere;
11 October: Fiery atmosphere, cloudless sky;
5 November: Pale atmosphere;
10 December: The air was very clear and looked like the air in the southern Indian Ocean during the typhoon season;
13 December: Lead-colored sky.
The observations were continued, collected, evaluated, and thoroughly discussed.
Five years after the eruption of Krakatoa, the scientific work on the events of the year 1883 were temporarily brought to a close with the “Report of the Krakatoa-Committee of the Royal Society.” A summary by J. M. Pernter was given in the Meteorologische Zeitschrift of 1899. The following information is derived mainly from this summary[41].
The most amazing aspect of the report is that it does not contain any mention of possible relevance of the oceans. Furthermore, the question of a possible change in the average temperature of the atmosphere does not appear to have interested anyone. Although it was quickly determined that the amount of solar energy received was clearly reduced for a period of several years, little attention was paid to the development of the atmospheric temperature. The blockage must have fluctuated strongly and have varied greatly, depending on the observation point. In total, the blockage effect has been calculated at an average of approximately 10% over a span of four years, whereby the reduction of solar energy in the northern hemisphere (Paris) was at its greatest in fall of 1885, reaching a value of 25%[42].
It would seem that a reduction of solar radiation of such proportions would necessarily have a long-lasting effect on atmospheric dynamics. But supposedly the average temperatures fell only slightly[43] and the atmospheric circulation in 1884 was above normal and did not sink to a strongly developed minimum until 1888[44]. While the equilibrium of the world of statistics may not have been disturbed by Krakatoa, events were rather different in the world of nature. Without the stabilizing effects of the ocean, the effect of Krakatoa would have been catastrophic. A person sitting in warm bath water does not experience any discomfort when the heating is turned off – at least, not right away. But what can possibly happen to the higher latitudes of the earth if the warm water from the tropics is already on the way? A cooling-off effect will only become noticeable after the passage of some time and continued blockage of solar radiation. The influence of the oceans was shown clearly by the fact that coastal areas had above-average temperatures in 1884, whereas continental land masses such as Russia, Siberia, India, China, Canada, and the USA (inland areas far from the Atlantic) recorded very cold winters in the years up to 1888[45].
This could be dismissed as coincidence if the time until 1886 had not been accompanied by another phenomenon, a “hazy fog”, a strange, smoky cloudiness in the atmosphere which was observed both in the tropics and in other areas. When Pernter further states (P. 410): “The hazy fog appears as a constant companion of the extraordinary optical phenomena in the atmosphere during the entire period of the atmospheric-optical disturbance”, then one can say – speaking non-technically – that Nature had “popped a lid over it” and so protected the oceans from cooling off too quickly. The lid consisted of ingredients provided by Krakatoa and water vapor provided by the ocean. As a result of the “dirtying” of the atmosphere by the volcano’s eruption, the atmosphere displayed characteristics and behavior deviating from the norm. Just as fog over a water surface sharply limits the transfer of heat energy, the hazy fog must have had a long-lasting effect. The dispute at the time as to whether Krakatoa had provided the water vapor (Pernter, P. 414) would most likely not have occurred if it had been assumed that the upper ocean water level (statistically speaking) was about 30° C. warmer than the atmosphere. The fact that the air circulation did not reach its minimum until 1888 is not surprising. From the middle of the 1880s on, a “weakening” of the oceans in the higher latitudes must have become noticeable. The less heat energy the ocean feeds into the atmosphere, the weaker become the dynamics in the atmosphere. This also becomes clear when it is seen that three years after Krakatoa the temperatures above land rose more sharply than above the oceans[46].
c) The Missed Opportunity
If climate is explained by average weather conditions and the oceans are allowed only a static place in events in Nature, as was the case until recently, then we really could go on with our daily affairs and regard Krakatoa as no more than an interesting event in Nature which gave us some beautifully dramatic sunsets. But when the oceans temporarily cool off, it does not mean that heat is withdrawn in equal measure everywhere from the upper ocean layer. As the oceans comprise a chaotic system[47], it must be assumed that the tendencies in the entire system change when an event such as the eruption of Krakatoa takes place and has an effect over a period of three to four years. The fact that the sum of the statistical values (particularly the global average temperature) showed little or no deviation cannot be proof that the event did not have any climatic quality whatsoever. An event which reduced the solar radiation by about 10% for more than three years cannot have failed to influence ocean currents and must have had to one extent or another short- as well as long-term consequences. In addition, the possibility that the oceans reacted in some way to a three-year “cleaning of the sky” of volcanic ash, pumice dust, and sulfuric acid, more than 2/3 of which landed in the seas, cannot be categorically excluded.
After the eruption of Katmai in 1912, the temperatures in the low and middle latitudes also rose by up to 1° C. and even more in the higher latitudes. Wexler of the US Weather Bureau wrote of this in 1951: The warming in the middle and lower latitudes can be a result of clearer air and increased transport of solar energy, but the warming in winter in higher latitudes during the Arctic night will have to be explained in another way[48]. Naturally, someone should have thought of the oceans.
The eruption is considered small at this stage and the volcanic activity has somewhat decreased since yesterday evening. The eruptive fissure is appr. 500 – 700 m long. The lava area is less than 1 km2 covering an area that is appr. 500 m wide. Lava fountains are small and lava flows are currently a very local hazard. The seismic activity is minor and spread around the Fagradalsfjall area. There is no indication of production of ash and tephra and currently gas pollution is not expected to cause much discomfort for people except close up to the source of the eruption. The gas emittions will be monitored closely.
The aviation color code for Keflavik international airport has been lowered to orange as there is no indication of production of ash and tephra and there is no imminent hazard for the aviation.
Reykjanesbraut – the main road from the capital region to Reykjanesbær and the international airport at Keflavík is open. However, Suðurstrandarvegur – the road along the south coastline of Reykjanes peninsula is closed between the two coastal towns Grindavík and Þorlákshöfn. Other roads and unpaved tracks in the close vicinity of the eruption site are also closed.
Updated 20.03. at 16.00 The eruption in Geldingadalur is not large, so it looks like gas pollution from the volcanoes will have little effect on the well-being and health of the inhabitants of the Reykjanes peninsula and the capital area. Significant precipitation is also forecast, which reduces the effects of gas pollution. It is primarily those who are most vulnerable to poor air quality who should possibly take action and follow the guidelines of the Environment Agency on their website.
An earthquake up to magnitude
6.5 could be triggered
Updated: 21 March 13:40 by
The Scientific Advisory Board of the
Icelandic Civil Protection
The Scientific Advisory Board of the Icelandic Civil Protection met yesterday afternoon, 20 March, to evaluate the latest developments of the volcanic eruption in Geldingardalur on the Reykjanes Peninsula. The conclusion of the meeting was that the following developments are possible:
The eruption will decrease gradually and end in the coming days or weeks.
New volcanic fissures could open at the eruption site or along the magma dike near to Mt. Fagradalsfjall.
The likelihood of a large earthquake close to Mt. Fagradalsfjall has reduced due to the ongoing volcanic activity.
An earthquake up to magnitude 6.5 could be triggered in the Brennisteinsfjöll volcanic system, located east of Mt. Fagradalsfjall.
Wikipedia General description of the Brennisteinsfjöll volcanic system The volcanic system of Brennisteinsfjöll is 45 km long, has a width of about 10 km and covers about 280 km2. Most to the south are the Stóra Eldborg crater row and to the north Nyðri Eldborg.[9]The volcanic system was the most productive of all the volcanic systems of the Reykjanes peninsula during the Holocene with 30-40 eruptions and around 10 since the settlement of Iceland in the 9th century.[9]
Updated 29.3. 2021 at 09:30 (posted here at 18 GMT)
The Civil Protection and Emergency Management’s Science Board held a meeting Friday (Mars 26.) to discuss the volcanic eruption in Geldingadalir on the Reykjanes Peninsula. A lot of data has been collected including on-site and remote measurements along with modeling work forecasting the event’s possible behavior over the coming days. A report detailing the event’s general status and proposals for regular monitoring will be released shortly.
Both the Icelandic Met Office and the University of Iceland’s Institute of Earth Sciences regularly post results and people are encouraged to view their web pages, twitter streams and Facebook pages.
The volcanic eruption in Geldingadalir has now been ongoing for nine days. The lava is basaltic and highly fluid with little explosive activity. It is a very small eruption and the lava flow has been steady at 5-7 m3/s since its onset. Currently the extent of the lava field is within Geldingadalur but if the eruption keeps ongoing at a similar rate, it is modeled that the lava will flow east towards Merardalur valley. If the volcano continues to erupt it could eventually end up being categorized as a shield volcano. Shield volcanoes are generally formed over long time periods with lava fields extending from a few to several kilometers around its source. There is no way to tell how long the eruption will last.
The current magma is rich in MgO (8.5%) which indicates that it is from depths of around 17-20 km. There has been constant gas pollution close to the eruption site, spatially determined by local wind conditions. Gases can accumulate to life-threatening levels in certain weather conditions. There have been no indications of significant tectonic movements since the eruption started. There is currently no indication of new openings at other locations along the magma injection path.
This eruption calls for specific and targeted monitoring of the eruption itself and also of the gas´s effects on air quality and the downwind environment.
Why climate models fail. Instead of El Niño, La Niña 2020/21 came.
Post Februray 26, 2021, last update March 14; see: box at the end (“La Niña 2020/21 weakens”)
For many decades El Niño has been a scientifically known and much studied climate event in the Equatorial Eastern Pacific (EEP). If climate models had even the slightest hint of reliability, there would have to be at least something in the forecast that an El Niñowill have had a large impact on the weather since autumn 2020. That turned out to be completely wrong. A La Niña has dominated the scene for more than a year and continues to do so. Such failures raise the question of whether science even understands what it is trying to talk about.
What matters most is the dimension and the conditions of the ocean. In the current case a paper from the Germany’s Potsdam Institute (PIK), which did the El Niño prognosis in February 2020 (1) assumed a “Very early warning signal for El Niño in 2020 with a 4 in 5 likelihood”. At that time and many months before the conditions indicated lower than average sea surface temperature (SST) , the opposite to warmer SST, representing El Niño, while La Niña is still in place now and for some more time (see: ‘climatereanalyser.org’ maps). They are the warm and cool phases of a recurring climate pattern across the tropical Pacific—the El Niño-Southern Oscillation, or “ENSO” for short.
The weaknesses of the scientific approach of the authors, Josef Ludescher et al., Can be easily identified. According to their understanding, analyzes are possible if:
Sophisticated global climate models taking into account the atmosphere-ocean coupling as well as statistical approaches like the dynamical systems schemes approach, autoregressive models and pattern-recognition techniques have been proposed to forecast the pertinent index with lead times between 1 and 24 months….
For the sake of concrete forecasting, we employed in [1] high-quality atmospheric temperature data for the 1950-2011 period. An average El Niño event typically increases the climate anomaly (deviation of global mean surface temperature from pre-industrial level) by about 0.1C. This suggests that a strong El Niñoevent in late 2020 can make 2021 a new record year, since air temperature rise lags Pacific warming by about 3 months
How can it be that one of the world’s most important climate research institutes pays so little attention to the influence of the Pacific on the ENSO interplay. All considerations must be based on the knowledge that this climate phenomenon is largely, if not exclusively, dependent on processes in the sea. Who instead, for example, “account the atmosphere-ocean coupling”, or ”employed in high-quality atmospheric temperature data” may fail. On one hand climatology regards ENSO is one of the most important climate phenomena on Earth due to its ability to change the global atmospheric circulation, which in turn, influences temperature and precipitation across the globe. On the other hand, climatology seems unable to acknowledge that the oceans govern the climate. ENSO is the ideal model case to understand this.
To understand ENSO and its influence on the atmosphere, one has to look at the dimensions that underlie this phenomenon. If one is aware of the volume of water in the Pacific and of the amount of warm or cold water that caused the ENSO, the latter is just a “drop in the Pacific”, as can be seen from the attached figures (next). The volume of warm or cold water masses in the ENSO event can hardly be expressed in a single-digit percentage in relation to the Pacific. The north-south extension is limited to a some hundred miles, the depths under the sea surface rarely more than 200 meters. In contrast, the Pacific has an average water depth of around 4000 meters and an average temperature of + 4 ° C.
La Niña 2020/21 status February 2021
Although ENSO is a long-known climate phenomenon, climatologists still follow the view of the meteorologists 100 years ago, according to which the atmosphere is at the center of all-weather events. They are generously willing to acknowledge that the oceans play an important role, but not that ocean temperatures and their contribution to atmospheric humidity are the most crucial factors. This can be seen in the example of ENSO. Although small in oceanic proportions, the weather above can have long distance effects. Once it happen, e.g. due to a lack of trade winds, the triggering cause remains the changes in equatorial water temperatures. The attempt to use computer models and weather observation data, by atmosphere-ocean coupling, ENSO forecasts failed with the 2020/2021 forecast and will not achieve what would be necessary in the future either.
What is needed is twofold: much more ocean dada (a), and acknowledging the supremacy of the oceans in climatic change matters (b).
No ocean area is as intensive observed as the Equatorial Eastern Pacific (EEP), well over 40 years. Since recently the Tropical Pacific Observing System, TPOS 2020, sustained sampling network is the “backbone” of the system, (Details: WMO). Whether this system can even provide nearly enough oceanic data to make predictions about what is going on under the sea surface cannot be judged here, but it is unlikely and for a long time.
So the other problem remains, the climatologists’ narrow view on the atmosphere. The authors of the El Nino forecast for 2020/21 failed because they lacked the insight that without comprehensive marine data, their model calculations are at best speculations. At least this conclusion should be drawn from their dramatic false prognosis.
In conclusion climatology should realize, that any ocean space, whether in size of a few hundred square miles or as covered by ENSO, plays an important role in climate matters, and that the latter should be regarded as a gift, to understand the mechanism quicker, on who is driving the climate. Author: Dr. Arnd Bernaerts
Post January 31, 2021, Added Feb.01, 2021, at the end ( link to article D’Aleo)
Arctic Sea ice is a big concern in the climate change debate. During the last 100 years three major shifts occurred. Less sea ice from 1918 to 1939; more sea ice formed from 1940 to about 1980, and retread again thereafter. Meanwhile the ice situation in 1939/40 is close to the conditions today, as just published paper by Guillian Van Achter et.al. , assumes (see next image). While the latter point is important to recognize, the authors fail taking in account what happened in the last century, with the high probability that the two major shifts have been caused by two devastation naval wars.
Instead of looking for anthropogenic links authors merely relate the Arctic sea ice retreat and thinning to greenhouse gas emissions and natural variability. Their introduction put it as it follow:
“On long timescales (a few decades or more), retreating and thinning are projected to continue as greenhouse gas emissions are expected to rise. However, on shorter timescales (1–20 years), internal climate variability, defined as the variability of the climate system that occurs in the absence of external forcing and caused by the system’s chaotic nature, limits the predictability of climate (Deser et al., 2014) and represents a major source of uncertainty for climate predictions (Deser et al., 2012). In this context, greater knowledge of Arctic SIT (sea ice thickness) internal variability and of its drivers is essential to document the true evolution of the Arctic atmosphere–ice–ocean system and to predict its future changes.”
To understand future changes, it seems foremost necessary to understand historical observations for which sufficient data and information are available as the G. Van Achter’s image shows (above). Required is to take the oceans into account. They are the main driver of climate, and the North Atlantic alone, and together with the Gulf Current, the main source of the Arctic sea ice conditions. How the three mentioned shifts did came about?
The story of World War I is simple. On the west coast of England, an arm of the Gulf Stream flows northwards to Svalbard and into the Arctic Ocean. A fierce naval war took place around the United Kingdom for 4 years, in the North Sea and also over the Gulf Stream. This messed up the “natural sea water structure” in terms of temperature and salinity and all these water masses ended up high up in the north. This caused a change in the water structure there. The mighty, cold, thick surface layer became thinner and so the warm Gulf Stream water could give off much more heat to the atmosphere. For two decades significant higher air temperature was observed in the Northern Hemisphere, ending suddenly with the beginning of World War II in September 1939.
The story of WWII is very different, but it is also not particularly complicated. In this case it is about the whole North Atlantic, north of the Straits of Gibraltar, the Strait of Florida and up to the North Cape. The sea area is several thousand meters deep and has a temperature of below 4 ° C. For more than six years there was fierce fighting in large parts. Whole sea areas were literally tumbled over many dozen meters deep, several thousand ships were sunk. There were huge explosions above, on and below sea level. This resulted in huge ‘shifts’ in the water structure which took years to return to the old ‘equilibrium’. A large part of it circulated the central North Atlantic (clockwise, lasting around 4 years). A smaller moved to the Arctic Ocean , which caused more sea ice over two dozen years. The more known result was a marked global cooling from 1940 to around mid-1970, the only global cooling since the end of the Little Ice Age (LIA), around 1850.
The story on Arctic sea ice after the 1980s is by far the easiest to explain. The overall conditions in the North Atlantic and Arctic Ocean indicate that a seven decade long period was required “to heal the sea from the wound WWII had inflicted”. About 3 to 4 decades to turn the cooling and increased sea ice trend back to a warming trend. And 3 to 4 decades to reach the same level as it existed in the late 1930s. In so far it is to note, that the lowest point was about 2012, but the sea ice is today back to the extent in 2005, in other word, the situation has stabilized during the last decade.
Finally, a comment on the overall situation. After the LIA ended in the middle of the 19th century, the trend had to go towards less Arctic sea ice for a longer period of time. Aside from the fact that many factors for sea ice changes from human activities in the oceans and the Arctic have never been addressed, but two of the most distinctive and unique trend changes cannot be explained without the two world wars. Even if the contribution could only be in a lower percentage range (which is very unlikely), it is irresponsible not to worry about an explanation as quickly as possible. That is forcing by man and has nothing to do with a “chaotic nature” but with physic. Author: Dr. Arnd Bernaerts
Link to two books on Climate Change and Naval War:
One can only wonder how even excellently trained and
experienced meteorologists like Joseph D’Aleo fail
to recognize the connection between the great naval wars
and the sea ice and temperature developments.
The Real Polar Temperature and Ice Story Wall Street Journal is pushing junk science that will lead to bad policies.
The latest is one of the favorite fake scare – disappearing ice. “World’s Ice Is
Melting Faster Than Ever, Climate Scientists Say”
How humans generated the cold period
from 1940 to 1970 and still ignore this fact.
Post January 20th, 2021
Few years ago David W.J. Thompson at al. attempted to explain “A large discontinuity in the mid-twentieth century in observed global-mean surface temperature“, published in NATURE, [Vol.453, 29May2008]. Whereas they confirmed that the Earth warmed from 1910 to1940** the subsequent cooling is explained very superficially, namely by a “variety of physical factors, such as atmosphere–ocean interactions and anthropogenic emissions of sulphate aerosols” and of “uncorrected instrumental biases in the sea surface temperature record”. That the large discontinuity has a strong correlation with World War II is not even mentioned.
Immediately Bob Tisdale (2009) question the conclusion, due to obvious similarities in the shifts of the SST , the cloud cover and the marine air temperature datasets, but either ignoring human activities at sea in the 1940s as well. One dozen years earlier two papers discussed “Temperature taken during World War II” [in the Pacific; in the North-Atlantic], by showing that a huge variety of observation need to be analyzed before considering any ‘corrections’. But as Tisdale wonders that Thomson et al pay not any attention to other datasets showing the discontinuity as well, he either is short in asking the question: What is the cause of the observed discontinuity in the 1940s.
The convincing answer is presumably not very far away. Since September 1939 huge water masses were churned up-side-down. As many ten-thousand ships plugged the sea every day, and billion objects exploded in the sea and sunk to the bottom of the sea, over several dozen meters or fseveral thousand meters. Aerial bombs, torpedoes and depth charges proved particularly effective. The photos shown are self-explanatory. One can only wonder that scientific interest in any human impact on climate by activities at sea does not exist.
Not interested in recognizing the human contribution?
Post January 14, 2021
Frequently the story about the Ice Storm in January 1940 pops up in newspaper. Three year ago THE GUARDIAN runs the story on 26/01/2018:1940 Ice Storm added to misery of war. January 1940 was coldest month on record for almost 50 years, freezing the river Thames. This year THE TIMES is earlier and published today (14/01/2021) a story about January 1940, titling it: Wartime ice storm turned UK into a strange frozen world.
When two respected newspapers rise with dramatic wording the attention of its readers, the matter must be a unique meteorological event. It was definitely, as THE TIMES explains:
January 1940 was dreadfully cold. The Thames was frozen for several miles between Teddington and Sunbury, the sea froze along parts of the south coast, and the ports at Folkestone and Southampton froze solid. Then on January 27 something extraordinary happened in southern areas when it rained — the instant the rain hit anything solid it froze into a thick layer of ice.
But that happened 81 years ago (more information below), and the Met Office in the UK is still clueless, as is the entire climatology. How can that be? The claim every day that they understand what happens with the global climate in the future, but fail completely to reasoning and explain why Europe in general (HERE), and Great Britain got an extraordinary cold January, and an Ice Storm, that went down as one of the most dramatic weather events in history. During the war data collection was in highest demand. But meteorology seems not able or willing to used them for a thorough investigation, which is particularly enjoying, because all the exceptional weather patterns in winter 1939/40 may have anthropogenic caused. Even if man only contributed a few percent, it would be completely unacceptable. Presumably contribute a lot if not all, to a winter weather that run amok. For an entire picture consult the website http://www.seaclimate.com/ , for winter 1939/40 the Chapter c, section C1 to C9.
For a broader picture on January 1940 in the UK, here after the text from other sources are reproduced.
January 1940 was the coldest month on record for almost 50 years, and would ultimately become the second coldest January of the 20th century. By the middle of the month, the river Thames in London had frozen over for the first time in six decades, while on the 21st, temperatures in mid-Wales plummeted to a record low of –23C. But the most serious event came towards the end of the month, when a clash of mild air from the south-west and cold air from the north-east produced very heavy snowfalls, including 1.2 metres (4 ft) of snow in Sheffield. In southern Britain, rain fell instead of snow, resulting in an even greater catastrophe, as trees, telegraph and power lines were all coated with a thick layer of ice – up to 0.3 metres in some places. This was too much to bear, and many branches and lines collapsed under the sheer weight of ice. To make matters worse, it then snowed, creating even more misery for people already bearing the burden of war. Known as the 1940 Ice Storm, this goes down as one of the most dramatic weather events in history.
In the United Kingdom, a snow and ice event occurred during January 26–31, 1940. As a warm front pushed into cold air, it led to an ice storm south of the Midlands, with some areas being covered in up to 300 millimetres (12 in) of glaze by the 31st, with totals still adding up for some areas into early February. Further north an extreme snow event had taken place, crippling cities that already had feet of snow cover. Sheffield had 4 feet (120 cm) of snow on the first day of the storm alone, with Bolton seeing 10 feet (300 cm) by the end of the storm. It is thought to be one of the most severe storms to hit the UK.[11]
January 1940. The coldest month of any kind since 1895 (-1.4C CET), and eventually he second coldest January of the century (after 1963). On the 17th, the Thames was frozen over for the first time since 1880. The morning of the 21st gave the lowest temperature of the month: -23C was recorded at Rhayader (Wales), with many places continuously well beneath freezing (e.g. only -4C maximum at Boscombe Down, Wilts.). There were heavy snowfalls in Scotland, with many places cut off. Most remarkably, there was a great snow and Ice Storm during the 27-30th, peaking on the 28th, but continuing in parts into February. Mild air approaching behind
warm fronts from the SW met the cold easterly all the way from Russia. There was heavy snow over the north; four feet of snow in Sheffield on the 26th, and 10′ drifts reported in Bolton on the 29th. Further south the lower air was warming up and was too warm for snow, but the rain froze as it fell, coating everything with a thick layer of glaze. The effects of the freezing rain was one of the most extreme weather events of the century. The south was particularly badly affected. Everything was coated in a thick layer of ice: phone wires 1.5 mm thick were coated with a 300mm diameter sheath of ice – up to 15 times their weight. Many large tree trunks and power lines were brought down. The area affected by the glaze reached from Kent to Exmoor and the Cotswolds, and from Sussex to Cambridgeshire and the north Midlands. It was a week before all the ice thawed; some places had snow on top of the glaze, with both remaining until the 4th February. Heavy snow and a violent gale swept the southwest.
Concluding
The UK Ice Storm in January1940 is well documented. It occurred in the fifth months since the Second World War commenced. The probability is high that warfare on land, at sea and in the air contributed significantly to the extreme cold winter condition in Europe. For decades climatology claims being able to tell us how climate is likely to work in the future, which is hardly convincing, if modern meteorology is unwilling or unable to explain an extraordinary event, as the Ice Storm eight decades ago. After all, climate change research is need foremost to understand what humans are causing or may contribute. The winter 1939/40 is an excellent field for research to make progress in this respect.
Suddenly, in January 1940, there were many cold records never measured before. The 1930s had been a very warm decade. Usually average January winter temperatures in Western Europe are above zero degrees Celsius. Not so eight decades ago. A dramatic drop stopped the warm winters in Europe. The situation turned to winters observed before the end of the Little Ice Age (~1850). For example: the coldest winter (November to March) since 1828 in Dresden and Berlin. All-time low ever observed and recorded, in Poland (-41°C), in Moscow (-41,2°C) and Wales (23.3°C). That came completely unexpected. What a drama. Not for climate science, which has not been interested in this sudden climatic shift until today? Does that indicate a lack of competence?
Few years ago several thousands climate experts from around the world arrived for a conference on climate change, hoping to find a way to improve the implementation of the Paris Agreement on climate change (adopted in December 2015). In Katowice, Poland, December 2018, the Parties aimed to finalize a detailed set of rules and guidelines to enable the Paris Agreement to be put into practice. Particular the monetary aspect, namely the promise to raise $100 billion a year, from both public and private sources, by 2020 to help developing countries to address climate change. The sum is mind-boggling, and the complete ignorance to simple historical events – for example the arctic winter in Europe 1939/40 – is shocking and dangerous.
The Second World War (WWII) was only 100 days old when weather in Europe started to run amok. It is easy to compile several dozen ‘unexpected and unusual’ events indicating that the weather started to leave common standards since December 1939. What happened as early as at Christmas Eve in Finland was alread horro pure (see a previous post HERE), as the climatic drama first culminated in January 1940, but continued well until mid-February, which is thoroughly discussed in numerous book chapter, online HERE & HERE.
One of the climatic high-lights of the winter 1939/40 had been a number of all-time cold records at many location in the Baltic Sea region, for example in Hamburg, on 12. February 1940. A month earlier Poland reached to an all time low, which brings us back to the current gathering in Katowice. In 277 km distance in NNE and about 50km west of Warsaw is the village Siedlce. Already on the 11th of January 1940 the thermometer dropped to the incredible level of minus 41°C. At that time the Baltic Sea was still not covered with sea ice, which only happened in early March 1940, and for the first time in the 20th Century. How that could happen so suddenly, after the year 1939 had been within the normal temperature range, actually there had been a lasting warming since 1918, and the late 1930s had been the highest ever recorded.
Under such circumstances it is highly ignorant and gross negligent to talk about climate change in Katowice, although human activities may have caused it, or highly contributed to record cold temperatures in January and February 1940. The ignorance is particularly annoying, as the mechanism which lead to the rampage of climate can be easily attributed to the warmonger Adolf Hitler, who started WWII and this initiated that huge naval force crisscrossed the sea, and churned and turned the sea up-side-down by shelling, mining, torpedoing, and bombing. The immediate consequences are easily explained by a daily exercise:
Too warm water is the baby-tube in cooled down by churning the water with the hand around. The North and Baltic Sea are like the baby-tube, warned during the summer season. If forcefully churned in autumn and earkly winter, any stored heat diminishes quickly, opening the way for cold air in anti-cyclones (high-pressure) to move westwards up the shores of the North-Atlantic, denying low pressure cyclones to travel straight eastwards, directing them either to the Barents Sea or South to the Mediterranean Sea.
That happened evidently in winter 1939/40. And what is climatology doing? They ignore it, although it would turn the whole climate change debate in a complete different direction. Evidence would be on the table that man is able to a moderate winter scenario into a disaster within a few months. One mad-man as Adolf Hitler is enough to cause the coldest winter in Europe over more than a century. The Katowice climate summit brought together around 30 000 delegates from almost 200 countries, top state officials, representatives of business and NGOs among them, but without the competence and interest to answer a fairly simple question: What cause the sudden climatic change in winter 1939/40? Which atmospheric condition caused the all-time cold record in the village Siedlce on 11th January 1940 and several other locations? An all-time record in Hamburg one month later?. What caused the full ice-cover of the Baltic Sea after more than 40 years?
Today, the 9th January 2021, eight decades later, the situation is very different, from which much could be learned, if there would be only more interest, willingness und competence. Since September 1939 until early 1940 not one single ‘natural event’ occurred! Carbon dioxide (CO2) was totally out of question. There was nothing, absolute anything that could have caused a climate change, but war on land, war at sea and war in the air.
Humans changed climate – 100 years ago – Which is still ignored by Science!
Post January 02, 2021
A sudden warming was felt all over the Northern Hemisphere. Today it is called Early Arctic Warming (EAW) and started after a very cold European winter 1916/17 in 1918. Naval warfare in Western Europe was at its highest in 1916 and 1917. Several thousand ships, war ships and submarines were sunk. All water masses churned by the navies flow north towards the Arctic. In 1918 air temperature increased in the Northern North-Atlantic dramatically. It should be regarded as a clear sign, how humans can influence and change climate!
Washington Post reported on 2 November 1922 based on information by the American consul in Norway to the U.S. State Department in October 1922 and published in the Monthly Weather Review with the sensational hint that in 1918 a strong warming began (see Fig above left). In August, 1922, the Norwegian Department of Commerce sent an expedition to Spitzbergen and Bear Island under the leadership of Dr. Adolf Hoel, lecturer on geology at the University of Christiania. Its purpose was to survey and chart the lands adjacent to the Norwegian sea mines, laid during First World War (WWI) on those islands, take soundings of the adjacent waters, and make other oceanographic investigations.
Ice conditions were exceptional. In fact, so little ice has never before been noted. The expedition all but established a record, sailing as far north as 81° 29′ in ice-free water. This is the farthest north ever reached with modern oceanographic apparatus.
The character of the waters of the great polar basin has heretofore been practically unknown. Dr. Hoel reports that he made a section of the Gulf Stream at 81° north latitude and took soundings to a depth of 3,100 meters. These show the Gulf Stream very warm, and it could be traced as a surface current till beyond the 81st parallel. The warmth of the waters makes it probable that the favorable ice conditions will continue for some time.
In connection with Dr. Hoel’s report, it is of interest to note the unusually warm summer in Arctic Norway and the observations of Capt. Martin Ingebrigsten, who has sailed the eastern Arctic for 54 years past. He says that he first noted warmer conditions in 1918, that since that time it has steadily gotten warmer, and that to-day the Arctic of that region is not recognizable as the same region of 1868 to 1917. Back in 2003 Willis Eschenbach did a closer examination of Vardø (see the Vardø –above) and also found the same discontinuity around 1920, amounting to 0.73°C. When that artificial discontinuity is discounted, the temperature rise is only +0.12°C per century, a tiny result for a region that according to the models should have undergone rampant warming in the last century. The text was published in October 2003 (see left) at http://www.john-daly.com/press/press-03b.htm , in Willis Eschenbach’s eyes the late John Daly was an early giant in the climate blogger sphere.
A detailed analysis is available in the Book, 2009, “ARCTIC HEATS UP – Spitsbergen 1919-1939”, p. 60ff; (online: http://www.arctic-heats-up.com/chapter_5.html) of which an excerpt is given as it follows:
Spitsbergen as a Heating Spot
If one asks whether the heating-up spot is to be found at Spitsbergen, we would answer: yes. The information supplied sustains this affirmative answer. Nothing demonstrates this better than the data record taken at Spitsbergen since 1912. If one reviews the January/February temperature difference between the winters of 1913/14 and of 1919/20 (ca. + 15oC), or from the winters of 1916-1917 to the winters of 1919-1920 (ca. + 22oC), the results are not only extraordinary, but they reveal that the “shift” took place in 1918, respectively in the winter of 1918/19 (Hesselberg, 1956). This is emphasized by the comparison between the data recorded from 1912, until WWI ended in November 1918 (ca. – 4.3oC), and thereafter (ca. +3.8oC), including the winter of 1925/26
In the summer of 1918 the seawater temperatures had already reached unusual values: +7oC to +8oC at the West coast of Spitsbergen (Weikmann, 1942). During the winter of 1918/19 the temperatures varied considerably. There were long periods in November and December 1918 with temperatures close to zero degrees, 4 days with temperatures above zero in November and 7 days in December[38]. In January 1919, the temperatures did not reach -5oC for 14 days, and five days were frost-free. The annual mean (1912-1926) with a minus 7.7oC suddenly jumped to an annual average of minus 5.4oC in 1919, representing a plus of 2.3 degree. The corresponding figures provide for January 1919 a difference + 8.6oC, which indicates that the sea was able to transfer a lot of heat into the air. However, during February-April 1919, the temperatures were well below the average (ca. -6oC), with a large ice-cover far out into the sea. But that did not affect the significant warming that had started a few months earlier and lasted until the outbreak of WWII in September 1939. The dramatic temperature rise in the 1920th and 1930th is shown in several of the Fig. attached.
CONCLUSION:
100 years ago the sea water temperatures at Spitsbergen suddenly reached unusual high values. After winter 1918/19 the warmth affected the entire Northern Hemisphere. In the USA it warming lasted until about 1933, elsewhere to winter 1939/40. The connection to the naval war activities in the North Sea and Eastern North Atlantic is obvious. Some six-thousand ships were sunk. Many millions explosions at the sea surface and many dozen meter below the surface shock the sea and churned it around, mixing the temperature and salinity structure thoroughly. More than 100 years have passed, and science knows nothing about the issue, neither shows any interest to know how much man has contributed to the climatic change for two decades. The EAW persisted over the next two decades and lasted exactly to the moment World War II commenced.
In science a precise and transparent language is paramount. Climatology is far from it. Many of the used terms in climatology are extremely superficial, if not meaningless, which is a major reason for the hysteria in the current climate change debate. And science is using them recklessly.
The result is obvious, when the claim is made: The world may already have crossed a series of climate tipping points, which mean an ‘existential threat to civilization’.(The Guardian, Nov.2019). Many climate scientists have warned that CO2 has pushed Earth dangerously close to a no-return threshold, beyond which lies an unlivable hothouse world. (See: Phy.Org Nov 2019). This belongs in the department: Scare monger machine.
The term ‘tipping point’ has its origin in physics and chemistry, meaning: that if an object becomes unbalanced, even a slight force can cause it to topple. Note that this explanation refers to “one object”.
Currently, the Intergovernmental Panel on Climate Chang (IPCC) says:
___ IPCC, Glossary – 4/06/2018.Tipping point: A level of change in system properties beyond which a system reorganizes, often abruptly, and does not return to the initial state even if the drivers of the change are abated. For the climate system, it refers to a critical threshold when global or regional climate changes from one stable state to another stable state.
___Wikipedia cites the IPCC in this way: The IPCC AR5 defines a tipping point as an irreversible change in the climate system.
The problem starts with referring to “a climate system”. The IPCC (2018) defines it as a“highly complex system consisting of five major components: the atmosphere, the hydrosphere, the cryosphere, the lithosphere and the biosphere and the interactions between them”, which has two principal flows:
It actually means nothing else as the interaction of nature, which explains nothing. All that this boils down to is ‘the interactions of the natural system’. What is the point of a term if it explains nothing? (See Letter to Nature, 1992)
Worst is the use of the word ‘climate’, which according IPCC is the statistic of average weather over a period of time ranging from months to thousands or millions of years, culminating in the fact that IPCC does not explains in the Glossary, what it regards as ‘weather’. (Discussion HERE)
The corresponding Glossary of the American Meteorological Society (AMS) is neither very helpful, merely saying that: The “present weather” table consists of 100 possible conditions, (More HERE ), thereby paving the way to a meaning that cannot be verified. There is no ‘object’, like in physics, which can become unbalanced, as mentioned above. But scientists speak about it, as if they understand the complexity of the unexplained.
T.M. Lenton et.al.paper from 2008 started with the sentence: The term “tipping point” commonly refers to a critical threshold at which a tiny perturbation can qualitatively alter the state or development of a system. The same authors: T.M. Lenton, S. Rahmstorf and HJ. Schellnhuber, et. al, published recently again an article in NATURE, 27. Nov. 2019, titled: “Climate tipping points — too risky to bet against”. They talk about ice collapse, biosphere boundaries, global cascade, offering nothing more than the believe, that by strongly forcing the system, with atmospheric CO2 concentration and global temperature increasing at rates that are an order of magnitude higher than those during the most recent deglaciation. Not one word can be found that the earth got warmer since the end of the Little Ice Age, around 1850, about 100 years before consumption of fossil fuel raised the CO2 level significantly. Not one word about the entire impact of the ocean and the impact of human activities at sea may have had since industrialization commenced. But like their paper in 2008, their tipping-points scenarios aim to raise scare, concluding with the warning: „We argue that the intervention time left to prevent tipping could already have shrunk towards zero, whereas the reaction time to achieve net zero emissions is 30 years at best. Hence we might already have lost control of whether tipping happens. A saving grace is that the rate at which damage accumulates from tipping — and hence the risk posed — could still be under our control to some extent.The stability and resilience of our planet is in peril. International action — not just words — must reflect this.”
Even the skeptical think-tank Global Warming Policy Forum (GWP), adopted the claim that “Global warming alone is insufficient to cause such a tipping point”, and that a better “insights into the role of water vapor may help researchers predict how the planet will respond to warming”. They cite an analysis by the MIT (Massachusetts Institute of Technology) in September 2018.The mere reference to atmospheric water vapor is very naive, because to a very high degree the oceans control it (see Fig. below). In a world were annually averaged sea surface temperature is about 16°C, but the overall ocean mean temperature are merely +4°C , even mentioning a tipping point, would indicate incompetence in climatic matters. That applies also to the above cited authors, T.M. Lenton, S. Rahmstorf and HJ. Schellnhuber, when they refer in their 2019 paper, inter alia, to parts of the oceans, in the Arctic, Antarctic and North-Atlantic. Discussing the general term tipping point without having a thorough insight into the interior of the oceans is a hopeless undertaking, if at all possible.
Every attempt to identify a tipping point in the natural system shows that users of the term understand little about the matter, and nothing about the oceans.
War in 1939 caused several weather records in the U.S.A.
Post: 29th December 2020
In autumn 1939 there is war in East Asia, and war in Europe. And suddenly the weather produce records, from wettest to coldest, across the USA.
Record wetness month September 1939 in Arizona (see Fig. 4 below)
Record driest month in November 1939 in 9 States (see Fig. 6 below)
Record warmest month in December 1939 in 3 States (see Fig. 8 below)
Record coldest month in January 1940 in in 7 States (see Fig. 2)
Weather changes in Europe are much more dramatic, but that is another story. Here we deal with weather records in the United States. The extraordinary conditions, almost eight decades ago, should be thoroughly explained for two reasons:
Were the records anthropogenic influenced?
Marked the records the start of the global cooling until the mid-1970th, the only and most severe cooling period since the end of the Little Ice Age about 1850.
Even the smallest percentage contributed by human activities to the weather pattern in winter 1939/40 needs to be understood and discussed in the general debate on climate change.
Three records in late 1939 culminated in the coldest (Fig. 2)
The fact that the first signs of a real winter emerged at Christmas time 1939 (NYT, Dec. 23, 1939) was presumably not worth a doctor’s thesis at any time. Neither that the winter earnestly came in early January 1940, with a frigid wave that gripped most of the United States (NYT, Jan. 6, 1940). Icy north-westerly winds swept over New York with force, on January 6, causing temperatures to drop to an average of 10 degrees Fahrenheit below normal. Frigid waves even touched northern parts of Florida (NYT, Jan. 07, 1940).
But the information by Dr. James Kimball published in ‘The New York Times’ on January 7th, 1940, that November 1939 had been unusually dry, should have been investigated by science, why that had happened, and whether military activities in China and Europe, and the increase of condensation nuclei had anything to do with it. The less humidity is in the atmosphere, the more easily it can be replaced by colder air. If the amount of water in the atmosphere is less than average, the ‘vacuum’ thus created, needs to be filled by air. The fact that the Northern Hemisphere was in such a state towards the end of the year 1939 is very likely and science could have found out why long ago. The USA had records in September, in November and December, which made it easy for Arctic air to travel south to filling up the gap. A detailed assessment is at: http://www.seaclimate.com/c/c4/c4.html,
A special September 1939 in California (Fig.4)
In September 1939 the sun state had to cope with a number of weather caprioles. The unanswered question until today is what role an El Niño event had in that place at that time, and the contribution of war activities in China and Europe, due to the excessive release of condensation nuclei. Much too extraordinary and seldom was the situation that caused high precipitation during September with 370% above normal in California (Alabama, 119%; Arizona, 335%; Nevada 327%; Utah 261%).
California experienced an eight-day-long heat wave since about September 16th before a tropical storm, formerly a hurricane, hit Southern California , at San Pedro early on the 25th with winds of severe gale force. The up to 11 Beaufort strong winds were the only tropical storm to make landfall in California in the twentieth century. The air pressure went down to 971 mb, and the excessive rain caused heavy flooding, e.g. September records in Los Angeles (5.24 inches in 24 hours) and at Mount Wilson, 295mm/11.60inches). It was the heaviest September rain in Los Angeles’ weather history and it broke the worst heat wave in Weather Bureau records, as measured by intensity and duration. (NYT, Sept.26,1939).
The scientific disinterest in investigating whether the exceptional conditions had been a reflex action in the atmosphere that reached North America from the French-German, or the Polish-German front in Europe, e.g. from thousands of planes in the air, from shelling and burning down Polish villages and Warsaw, or even from fighting in China is stunning. That El Niño had a stake in the issue will be hard to prove, as the air temperatures at the equatorial Pacific was neutral, if not in La Niña condition (see: Fig. at left).
For references and further details see http://www.seaclimate.com/f/f.html .
The driest November on record (Fig. 6)
Except for a few States in the east (see above), the fall season was extremely dry over large areas. For all the areas east of the Rocky Mountains it was the driest fall on record (Martin, 1939). For about 9 States it is the all-time record and the dryness must have severely affected southern Canada as well. Time magazine titled on December 25th, 1939: “WEATHER: Driest Fall”, and reported “the driest fall on record, a severe case of spotted drought affecting 97,000,000 U.S. acres. About 16 States had less than 33% of their normal November precipitation.
The warmest month in December 1939 in 3 States
(see Fig. 8)(without text)
What else was curious in late 1939?
The 1930s were famous for the ‘Dust Bowl’, during which severe dust storms caused agricultural damage to American and Canadian prairie lands. In some areas this phenomenon lasted until fall of 1939, when regular rainfall finally returned to the region.
After extreme amounts of precipitation in September and dryness in November (see above) December came along with another curiosity. The overall monthly temperature record was considerably above average (TM5). In three States the all-time record had been observed. In the east, a change was already expected for the beginning of the holiday season: “White Christmas is likely for city” (NYT, Dec. 23, 1939). It took a few days longer for winter to come. On the 28th, it was time to report: “A biting northerly, driving grey, snow-laden clouds before it, brought to New York yesterday the coldest day of the winter. Shortly before 10 A.M. the mercury dropped to 11.9°F above zero”(11°C), (NYT, Dec. 28). Soon in 1940 the “Winds sweep the city as cold grips the U.S. ”, with “a mark of 11°F below (-24°C) in Indiana (NYT, Jan. 07, 1940. An exceptionally cold January 1940 had reached the United States , as shown in Figure 2 (above)
Further north, in Canada, the situation was partly reverse, as Brooks (1940) explained in a paper only few months later:
“Paradoxically, most of eastern Canada north of latitude 48° was above normal, with temperatures ranging up to more than 25°F above normal north of latitude 58° and 18°F above normal in the interior of Alaska. Missouri was actually as cold as the Hudson Bay region for the month”.
Natural variation?
The Timing: The ‘timing’ between excessive rain in Europe and the dry months in the United States is a perfect indication of the relationship between both events. Any ‘interchange’ between dry and wet air takes its time. A dry or humid air body can exist from up to several days to a few weeks. An ‘air body’ needs a couple of weeks to circle the Northern Hemisphere. Scherhag (1951), analysed a disruption in the circulation of air in the winter of 1940, and states with regard to air movements that there must have been a subsequent air-body-transfer (“Massentransport”) from the Southern Hemisphere towards the Arctic, which means, that ‘dry air’ from Europe could have circled the globe for some time before a ‘humidity gap’ could be refilled. This also confirms that there was a ‘humidity gap’ in the first place. If the ‘dry-out’ had not been caused by military activities, what else could have caused it?
Record Warmest vs. Record Coldest: The fact that temperatures in December 1939 had been widely above normal, versus the observation that in the south-east of the U.S. recorded values were much below normal with eight States experiencing the coldest January on record should be enough reason to ask why, and to consider whether it had something to do with war activities elsewhere.
The Regions Covered: January 1940 was cold in all Northern Hemisphere regions, viz. North America, Northern Europe and Northern Asia. This is a strong indication that there was too little humidity in the air (as proven in the case of the USA – above), giving arctic air a free path to penetrate deep into southern regions.
Difference between the winters in the USA and Europe: A further piece of evidence is the fact that the severity of the winter in the United States was over by the end of January 1940 (Brooks, 1940), whereas extreme winter conditions prevailing in Northern Europe during February 1940 show that a number of countries, e.g. Holland, Northern Germany and Southern Scandinavia, experienced their coldest winter for more than a 100 years.
Lower air circulation: The winter of 1939/40 was the result of a comprehensive general disruption of the atmospheric circulation, which could be regarded as a ‘prototype’ for a weakened circulation. Less humidity in the atmosphere and lower temperatures in seas and oceans, due to naval warfare in the waters of Northern Europe , inevitably caused disruptions in atmospheric air movements.
Summary:
A number of indications show that the war in Europe and in China may have significantly influenced winter weather conditions over long distances. In this case, North America had a severely cold January in 1940. Most likely, it had been supported by a lack of usual rain in the United States during the months of October to December 1939, in the first place due to generating condensation nuclei by military activities in Asia, in Poland and along the Western Front in Europe. The obvious “rain forcing” in autumn 1939 that caused low humidity in the atmosphere, made it easy for arctic air to forcefully travel down to the mid-latitudes of the Northern Hemisphere. The timing of ‘dry air’ and the invasion of polar air over all NH continents suggest that this was not a mere natural variation. The drier the air properties at lower latitudes are, the easier arctic air can spread southwards. The lower maritime influence is (warm moist air), the more continental conditions will prevail (cold dry air). The Northern Hemisphere felt it with full force in January 1940. A severe winter, the coldest in one hundred years in countries bordering the most war-affected seas in Northern Europe, did not come ‘just out of the blue’, but it was a combination of too dry air circling the hemisphere and naval operations in the marine environment of Europe.
For a complete overview on WWII and Weather from September 1939 to February 1940 consult
Book 2012, Chapter C1 to C9 (page 43-104) at: http://www.seaclimate.com/
The NYT reported on soldiers that “turned to wax” on Christmas Eve 1939.
An unsolved climate case: Why?
Post: 21th December 2020; Read 4 min.
Climate change has two sides. If natural we do not need science. If we assume it could be man-made, competent science is needed to explain why and able to say what needs to done to prevent it. Here we raise a very significant weather event, which science has never attempted to explain, even eight decades have passed. What a big mistake!
World War II was only four months old, and suddenly the weather run amok in Norther Europe. Although “The New York Times” reported from Rovaniemi/Finland on December 25, 1939, a highly challenging weather story, climatology completely ignored ever since. They never asked why it happened ‘out of the blue’, whether it could have been significantly cause by man, who had been in the fourth month of World War II. James Aldridge reported to the NYT on December 24th 1939 the very sad story, which reveals a lot about those claiming to understand how the atmosphere works. Read yourself:
Quote: “The cold numbs the brain in this Arctic hell, snow sweeps over the darkened wastes, the winds howl and the temperature is 30 degrees below zero (minus 34.4° C). Here the Russians and Finns are battling in blinding snowstorms for possession of ice-covered forests. …I reached the spot just after the battle ended. It was the most horrible sight I had ever seen. As if the men had been suddenly turned to wax, there were two or three thousand Russians and a few Finns, all frozen in fighting attitudes. Some were locked together, their bayonets within each other’s bodies; some were frozen in half-standing positions; some were crouching with their arms crooked, holding the hand grenades they were throwing; some were lying with their rifles shouldered, their legs apart….Their fear was registered on the frozen faces. Their bodies were like statues of men throwing all their muscles and strength into some work, but the faces recorded something between bewilderment and horror”.
Unquote
Few further information:
___In December 1939; Total losses of the Finnish armed forces were: about 13.200
___In December 1939 Total losses of the Russian armed force: presumably 3 to 5 times higher than the Finnish losses.
Temperature forecast Rovaniemi/Finland, 19-31 Dec. 2020; (see image)
The very cold Christmas in Finland 1939 was only the beginning of a dramatic winter in Europe. It became the most severe in many parts of Europe for more than one-hundred years. There are plenty indication that the war contributed heavily. But neither meteorology nor climatology have ever shown any interest, on either confirm the anthropogenic massive contribution, or demonstrate competence by naming a different causation of the extraordinary winter 1939/40.
Or do they fear undermining their greenhouse theory? It would indeed be shocking to learn after almost a full century that man is to blame for the horrible Christmas story that James Aldridge has covered in the NYT.
The so called ‘Winter War’ between Russia and Finland lasted from November 30, 1939 to March 13, 1940. Poland had already over-run and Warsaw already “burned down” in September 1939. In the European war scenario, the war activities in Finland during December 1939 were only a “sideline” in the whole war picture. Nevertheless, the NYT Christmas story reported a remarkable event, serious enough that should have caught the attention of science.
After all, climatology is dispensable, if not able and willing to investigate any case, whether big or small, which may indicate how human activities could or have contributed to significant weather events and climatic changes. What a big failure. Eight decades have passed without to take note of James Aldridge’s Christmas story 1939.
A big Arctic Warming started 102 Years ago! Human caused? The interest is nil!
Post: 09 December 2020
Climate changed suddenly in 1918. Within few months air temperatures in the Arctic region increased, for three years dramatically. Until nowadays science does not know why. They never connected this event with the fact that it occurred after a devastation war in Europe from 1914 to November 1918. The rise continued less pronounced all over the Norther Hemisphere., in some regions up to two decades. Fifty years later, after a cooling period from 1940 to the mid-1970s warming resumed and science explained that it was due to the human produced release of carbon dioxide ()CO2) in the atmosphere, which would diminish the sea ice the Arctic regions and increase climate changes. But why had they been unable to investigate the causes for the warming. More than one-hundred years have passed? A anthropogenic contribution of CO2 was it for sure not. Do they fear such finding could destroy their theory on the greenhouse-effect? One key to understand any climatic shift is the Arctic. Although it is a top topic in science since several decades, it is outrageous how superficial the question on climate change in 1918 is handled.
A recent paper “Rapid reductions and millennial-scale variability in Nordic Seas sea ice cover during abrupt glacial climate changes” by researcher Henrik Sadatzki, et al. (1) from the Niels Bohr Institute, at the University of Copenhagen, claims that abrupt climate change occurred as a result of widespread decrease of sea ice. By analyzing the last glacial period, app. 10,000 – 110,000 years ago the Northern Hemisphere was covered in glacial ice and extensive sea ice, covering the Nordic seas. But as soon as the Nordic Seas changed abruptly from ice covered to open sea, the energy from the warmer ocean water was released to the cold atmosphere, leading to amplification of sudden warming of the climate. The study concludes, that sea ice is a “tipping element” in the tightly coupled ocean-ice-climate system. This is particularly relevant today, as the still more open ocean to the north can lead to similar abrupt climate change.
The paper assumes that scientific evidence for abrupt climate change in the past has finally been achieved. Doubts are justified. Sea ice is an element between the interaction of ocean and atmospheric energy, but also a “tipping point”? A much more recent warming event, the so called Early Arctic Warming (EAW) from 1918 to 1939 certainly followed other rules. It has caused the most pronounced warming of the Northern Hemisphere since the end of the Last Little Ice Age (~1850), lasting in North America until about 1933, and in Europe until winter 1939/40. The EAW was primarily related to a sharp rise in winter temperature since 1918, gradually decreasing subsequently, which is a strong indication that the warmth derived for the Nordic Seas and related currents that flow into the Arctic Ocean.
To summarize the problem, it follows an excerpt from the Book : “How Spitsbergen Heats the World – The Arctic Warming 1919-1939”, Chapter 2C, (2):
QUOTE The early arctic warming and modern assessments Many scientists confirm broadly the early two decade long warming period (WHEN) but fall short of identifying the exact time period and location, of which a few are here presented exemplary: • The warming in the 1920s and 1930s is considered to constitute the most significant regime shift experienced in the North Atlantic in the 20th century (Drinkwater, 2006). • The huge warming of the Arctic that started in the early 1920s and lasted for almost two decades is one of the most spectacular climate events of the 20th century (Bengtsson, 2004). • At least Polyakov (2002) get the timing right: The period from 1918 to 1922 displays exceptionally rapid winter warming not only in the circum-Arctic region northward of 62oN. (Polyakov, 2002). • A meridional pattern was also seen in the late 1930s with anomalous winter (DJFM) SAT, at Spitsbergen (Overland, 2008). • Average Arctic temperatures increased at almost twice the global average rate in the past 100 years. Arctic temperatures have high decadal variability, and a warm period was also observed from 1925 to 1945. (IPCC, 2007) When it comes to explaining the causation of the warming (WHY), the matter seems rather sketchy than well founded. Here only two examples: • Natural variability is the most likely cause (Bengtsson, 2004); • We theorize that the Arctic warming in the 1920s/1930s was due to natural fluctuations internal to the climate system (Johannessen, 2004). UNQUOTE
The EAW had defiantly been a climatic shift, the most pronounced since 1850, only followed by the a severe global cooling from 1940 to the mid-1970s. In both cases neither an increase or decline in sea-ice cover, show up as significant contributor. As the sun can be excluded concerning the EAW during the winter season in the higher Northern Hemisphere, the only cause remaining is a substantial shift in the structure of the Nordic Seas, which are likely to have caused by two factor.
First reason: Shift in the Arctic Ocean structure since the end of the LIA
A shift within the Arctic Ocean was underway since the 19th Century. During his Arctic voyage with his ship “FRAM”, from 1893-1896, Fridjof Nansen, observed (see image) that the colder sea-cover layer (and lower salinity), over a warmer and saltier water layer, was thinning. The lower level, several hundred meters thick, was Atlantic water carried into the Arctic Basin. While in Nansen’s time had been in a slow process, it accelerated three decades later due to human activities at sea.
Naval War, 1914 to 1918, a force to recon
Around the years of the 1910s, nature had run its normal course. No “natural” event, which could have affected the natural commons, had been observed in the North Atlantic or Arctic region, or at a global level. There was no significant earthquake, no eruption of a forceful volcano, no tsunami, no sunspots, and no big meteorite fell on the continent or into the sea. But with the commencement of the First World War (WWI) the situation changed.
WWI had destructive effects on men and on the environment, but nothing changed the commons of nature as much as the naval war did. This notion derives from understanding that the oceans, together with the sun, determine the status of the atmosphere on a short, medium or long term. Human war activities at sea penetrate and churn the sea surface layers of 50 meters and lower depth. Huge water masses in Western Europe seas were churned upside-down by naval war activities. The Norwegian Current transports these water masses northwards, to Spitsbergen. The temperature and salinity structure of the water had certainly changed its composition.
The total loss of the Allies ship tonnage during WWI is of about 12,000,000 tons, namely 5,200 vessels. The total loss of the Allies together with the Axis naval vessels (battle ships, cruisers, destroyers, sub-marines, and other naval ships) amounted to 650, respectively 1,200,000 tons. Most ships that were sunk transported a variety of cargo, and all of them had equipment and provisions on board. The total number could be somewhere in the range of 10-15 million tons. It has been never quantified how much cargo and provisions surfaced and traveled with the currents towards the Arctic region and how the sea and sea-ice interacted with all that stuff – a matter that should not be ignored outright.
The naval war from1914 to 1918 can be considered as the most comprehensive single event in the 1910s that has altered the common sea body structure around Great Britain through a huge variety of activities and means. All naval activities around Britain had changed the water structure that moved on toward the North. The distance between Spitsbergen and the main naval battleground was of about 2000 km. But this distance is not very significant in this case. The currents moving along the Norwegian coast consist of water from the North Sea and of water from the Golf Current, flowing at a medium speed of 0.1 km/hour. At the sea surface, the current is up to 10 times faster.
The branch of the North Atlantic Current has temperatures exceeding 6°C and salinity greater than 35. The main arm is well below the sea surface and in quite a distant to the coast of Norway. The Norwegian Coastal Current flows closer to the coast of Norway in the upper 50-100 m of the water column with lower temperatures than the Atlantic branch and low-salinity water, less than 34.8.
What does a system shift mean in respect to the Spitsbergen/Arctic region? The main answer is simple. The incoming warm water of the West Spitsbergen Current was “positioned” in a manner that it could release more heat into the atmosphere. This can happen in two ways: I.) the sea ice forming during the winter season diminishes, which would not explain the suddenness of the shift; or II.) the thickness of cold sea water layer above the warm water was suddenly substantially reduced so that the air temperatures could immediately benefit from warmer water close to the sea surface. This was actually the case. In the mid-1930s it had been already discovered and published, that since the FRAM expedition in 1893-1896 the cold surface layer had grossly weaken, observed the Russian oceanographer J. Schokalsky, 1936 (3):
“The branch of the North Atlantic Current which enters it by way of the edge of the continental shelf around Spitsbergen has evidently been increased in volume, and has introduced a body of warm water so great, that the surface layer of cold water which was 200 meters tick in Nansen’s time, has now been reduced to less than 100 meters in thickness.”
What further evidence is required to attribute the EAW from 1918 to the 1930s to naval war activities during WWI? This knowledge is necessary in order to better understand the mechanisms between sea, sea ice, atmosphere and human influence on processes in the Arctic. The sudden shift into the EAW, was a significant climatic change event, strongly enhanced by naval war activities. Instead of analyzing the last glacial period, app. 10,000 – 110,000 years ago, a thorough understanding of what the WWI caused changes in the North Atlantic and Arctic Ocean and subsequently on weather and climate is urgently required. Henrik Sadatzki, et al. conclusion that sea ice is a “tipping element” in the tightly coupled ocean-ice-climate system, would certainly require a revised and more convincing classification.
Climatologists should recognize: The World Is Not Flat.
Post: November 30, 2020
It has been some time since Nicolaus Copernicus (1473 – 1543) was able to lay the foundations for understanding that placed the Sun rather than Earth at the center of the universe, by convincing a few of his ccontemporaries that the Earth was a spinning ball and not flat. Eventually the subsequent generations accepted the view. Particularly for earth sciences a breakthrough, encouraging all disciplines to keep an eye on the whole picture. However, if it comes to the climate debate, one may could ask, whether science has focused its research and analysis too closely, which could raise the impression that the climate debate is based on view comparable with those before Copernicus: The Earth Is Flat.
The climate change debate heavily focuses on the atmosphere. That is the domain of meteorology, focusing on atmospheric physics and weather forecasting, since the 19th Century. In brief, ‘climatology’ emerged much later (since the 1950th) and process meteorological data statistically. For these camps, the global warming is an atmospheric issue, based primarily on the concentration of carbon dioxide (CO2) in the air. But it is by far too narrow to discuss the undeniable global warming since the end of the Little Ice Age (about 1850) on such narrow terms. The oceans play a very dominate role, and are often ignored with meaningless wording “Natural Variability”.
A recent paper by Indrani Roy titled: “Major Climate Variability and Natural Factors in Boreal Winter”, (Springer-Link; Jun082020)* concludes:
A rising trend of global temperature is noticed during periods of 1860–1880, 1917–1944 and 1979–1997 which suggest that the Sun, explosive volcanos and ENSO(El Nino Southern Oscillation) have roles in regulating global temperature; and
…..the solar, NAO (North Atlantic Oscillation) and ENSO relationship needs to be investigated with additional care.
Two of the mentioned sources, sun and volcanos, are non-oceanic, the two others, ENSO and NAO, are practically mere air temperature statistics and explain little to nothing about the oceans internal physical dynamics.
The paper mentions the sun, but is silent on the global mechanism between the sun and the oceanic water masses, and that primarily the ocean temperature structure matter. It says:
The Sun is the main source of energy of the earth, but the level of scientific understanding relating to its influences on climate is still low (IPCC 2013). Regarding energy output, there is only a 0.1% change between maximum to minimum of the solar 11-year cycle (Lean and Rind2001), which is too negligible to influence climate.
The statement clearly misses to acknowledge that the oceans control the atmospheric vapor, due to its volume, extent, and temperatures. Even during the last two major volcanic events, Tambora (1815) and Krakatoa (1883), the oceans vast store of heat, damped the impact of a stark reduced energy input from the sun.
When the author assumes (Introduction) that: : In understanding climate variability and in interpreting signals of climate change, it is important to ascertain the actual role of natural factors, so that any human influence may be more accurately identified, reference to ENSO and NAO discusses correlations in weather pattern, but not in physical dynamics. Any change in sea surface temperatures over the tropical eastern Pacific Ocean (warmer ENSO), is not a “natural variability”, but a change in the Pacific is based on the law of physics.
Even more distinct from the ‘law of physics” is the reference to fluctuations of atmospheric pressure at sea level (SLP) between the Icelandic Low and the Azores High, known as NAO. Calling it a “weather phenomenon” (see Wikipedia about NAO) or “Natural Factor”, is so close to the point as the forbearer of Nicolaus Copernicus understood their world, as the center of the universe and flat.
Science will fail to understand climate changes if they continue not taking the laws of the ocean more serious. It already starts with any superficial handling of global temperature as noticed during periods of 1860–1880, 1917–1944 and 1979–1997 (see above). The 20th Century experienced two pronounced climate changes, timely connected to two world wars, already fairly well documented at that time, with abundant observations, fully available to identify human influence on the weather and climate due to activity at sea.
More at: http://www.seaclimate.com/ ; published as Book in 2012.
A.F. More at al. fail to explain what they call “a 1914–1918 climate anomaly unmatched in 100 years”! – AGU “GeoHealth” Sept.2020 –
Posted: 26th September 2020
Who would oppose when every scientific effort is made to help contain a pandemic? Not even if he comes from the American Geophysical Union (AGU). A few days ago she presented the article by A. f. More et al. in the network, which reads:
The issues addressed are clearly recognizable: a) a significant climate change during the First World War and b) a pandemic called the “Spanish Flue”. As key-points are named:
Novel, high‐resolution climate record from Europe shows strong influx of marine air in a 1914–1918 climate anomaly unmatched in 100 years
Independent precipitation, temperature, and historical records corroborate the timing and extent of the anomaly
Historical and epidemiological records indicate that this climate anomaly affected the mortality in WWI as well as the “Spanishflu” pandemic.
Obviously, the authors (in total eight) attempt to link a five-year climate change and a pandemic with “tens of millions of victims “. Whether that is scientifically well founded and makes sense, and is helpful to for a better understanding of the current COROA 19 pandemic is solely their responsibility. On the other hand the aspect, what happened to the weather during the six war years, raises our interest greatly.
The essays highlight a climate anomaly from 1914 -1918, but fails to explain it.
Rarely, if ever, has a scientific essay in a climate change matter been fixed to a precise time period of six years, by saying: Here we present a new, high resolution climate proxy record from the high Alpine Monte Rosa (4,450 m a.m.s.l.) Colle Gnifetti (CG) glacier in the heart of Europe, indicating abnormally high influxes of North Atlantic marine air in the years 1914–1919.
This statement is a very decisive statement, because it forces war activities and weather extremes to be brought into context and analyzed. Did one condition the other? But the paper is completely silent on any consideration, what may have caused the great weather anomalies during the very limited time period from 1914 to 1918, mentioning merely in very broad terms: “The environmental and especially climatic conditions in which the pandemic developed have received less attention in the scientific literature, even though historical accounts universally describe abnormally high precipitation and cold temperatures”, or by references to a few subsequent observations for example: During the battles of Verdun (1916–1917), the Somme (1916), the Chemin‐des‐Dames (1917), and the Third Battle of Ypres‐Passchendaele (1917) (Barbante et al., 2004; Hussey, 1997).”
The collection of meteorological data was by far not less during the war, and sufficient enough to do a much more in-depth research. The lack of ability and willingness is presumably strongest correlated to the inability of climatologist to ask and investigate the role of naval war activities from 1914 to 1918 on individual weather conditions in particular, and ‘unmatched climate anomaly’ in Europe from 1914 to 1918. That even short-term naval activities of one or few days have an impact on weather is analyzed in the following two papers:
The naval war in WWI lasted not only days but more than half a decade. That a leading scientific society, consisting of over 62,000 members from 144 countries (Wikipedia ), and founded in 1919, intended to promote geophysics, has missed to understand, that “oceans make climate”, and warfare shaped the weather across the war areas and beyond during WWI and thereafter (see references at text end), is a hard to understand this failure.
Naval warfare caused the climate anomaly from 1914 -1918, but science ignores it.
Half decade warfare tells uncountable stories. Naval war either, but the question on the impact is confined to human activities over and in the sea, and the causes on the weather and climate. “Water is the driving force of all nature”, Leonardo da Vinci (1452-1519) told the world long ago. And in the world of geophysics all sea water exceeds the water in the atmosphere in a ratio of 1000: 1. The effect of a naval war in action requires a great deal of very detailed investigations. There is none for that. Neither in correlation to the 1st World War, nor concerning the more dramatic naval warfare during WWII in the period from 1939 to 1945. But there are numerous weather phenomena that are very likely to be associated with war at sea. Science has so far shown itself neither capable nor willing to recognize and intensively investigate this.
Here after are shown a few examples from WWI :
Evidently Sea Ice generated in the Baltic Sea by Naval Warfare
The Baltic Sea was an extensive scope for all sort of naval activities from August 1914 until the Russian October Revolution 1917. The sea ice cover increased with the length and intensity, but diminished since winter 1917/18, when the naval war in the Baltic Sea ceased due to the Russian October Revolution. Had fighting continued, had this sea got another record cold year? After winter 1941 C.J. Oestman starts his lengthy ice report “Isvintern 1940-41”:
“Very rarely are two severe ice winters directly followed one after the other – since 1870 when regular ice observations started in Sweden. Except for the last two winters, these are -1939/40 and 1940/41 the only other cases are 1915/16 and 1916/17.”
Ship operation impact on SST and Winter Air Temperature
Fact is that the war winters prior 1919 had been very cold in Europe. At the top stands the winter 1916/17. For Great Britain it was the third coldest on record. In all sea areas around the UK naval warfare activities was enormous. How did the sea water temperature in the English Channel contributed? The Royal Navy had to do a lot of surveillance, mine sweeping and war activities in the English Channel. For example in September 1916 a flotilla of about 570 anti-submarine vessels were on hunt for three U-Boats operating for about one week. The operation of such a flotilla is presumably reflected in the record of sea water temperature (SST) taken in the English Channel for the year 1916-1917 (see image). This suggests the conclusion that a cooling of the English Channel water by naval activities will inevitably support cold winter conditions in Great Britain and Europe.
Extreme weather conditions in Great Britain and Svalbard
The third example is an observation made by a scientist from Kew Observatory near London in 1942: “Since comparable records began in 1871, the only other winters as snowy as the recent three (1939-1942), were those of the last war, namely 1915/16, 1916/17, and 1917/18.” (Drummond, 1942)
The few examples combined with observations during WWII can be regarded a conclusive evidence between war activities at sea and exceptional weather conditions. Both World Wars offer many more. It is high time to discuss climatic changer matters in the light of these two brief periods, as discussed in two books in detail:
AGU and any of their authors as: A. f. More et al., have to realize that WWI & WWII have a lot to offer to understand better how weather and climate works, and that it is irresponsible to ignore human activities at sea, whether in time of peace or war.
Is failing to have a Plan B as much a crime, if cooling is just as possible as a warming?
Post: 12th July 2020
Is failing to have a Plan B as much a crime, if cooling is just as possible as a warming? It’s amazing how ignorant man can be! That applies for ‘infectious diseases” and “climate change”. In both cases, the ability to look ahead and the crisis management are not very convincing. While dealing with pandemics has recently proved far less that reasonable, preparing for “climate change” is a disaster, if merely meant as “global warming”, and only described as “climate change”, which should be in the long run regarded as “climate crime”, according a UNESCO publication (see Fig. on the right). Ignorance and blindness is not good for the future of mankind.
The infectious diseases matter
100 years ago, between 50 and 100 million people worldwide died of an unknown virus within a few months. A total of around 500 million people are said to have been infected. Currently in 2020, within the first 6 months after the first signs of the coronavirus (COVID-19), more than 12.5 million infected were registered and 560,000 deaths assigned to this pandemic (as of July 11). Since the fall of the Roman Empire there have been more than a dozen until 1918/19,. The Black Death (1346-1353) is estimated to have killed 30% to 60% of Europe’s population. More recently the H1N1 Swine Flu pandemic, 2009-2010, infected as many as 1.4 billion people across the globe and killed between 151,700 and 575,400 people.
Although virology – the scientific study of viruses began in the late 19th century, by January 2020, the world was not ready to face the pandemic. Even now in July the situation is not safe under control. But that is by far not the most serious failure by modern society. Presumably it is handling the issue “climate change”.
The climate change issue.
Reputedly the United Nations secretary general, António Guterres, has called climate change “the most systemic threat to humankind” and urged world leaders to curb their countries’ greenhouse gas emissions.” (NYT, March 29, 2018) His call has a strong backing. According NASA:
Multiple studies published in peer-reviewed scientific journals show that 97 percent or more of actively publishing climate scientists agree: Climate-warming trends over the past century are extremely likely due to human activities. In addition, most of the leading scientific organizations worldwide have issued public statements endorsing this position.
Here is not the place to challenge “climate-warming”, nor the lack of reasonable scientific terminology (see our previous posts, e.g. HERE & HERE), but the narrowness of the view that the truth is to 97% global warming. Neither the current nor one of the historical pandemics has been handled with so extreme ignorance and short-sightedness as the scientific claims and general discussion on “climate change” and “global warming”.
Warming versus Cooling
The starting point is that without the sun nothing would work on earth, but radiation fluctuations alone may change the earthly system a bit over a period of time, which is presumably the only result from varying radiation. As far as “scientists think 100% of global warming is due to humans” (see: CarbonBrief), we are on safe ground. The sun can be excluded, man is not involved.
Concerning large climatic fluctuations, more relevant for sustainable human life on earth are the two earthly components, volcanoes and the oceans. The effects of volcanoes are well known. It gets colder regularly wherever volcanic ash reduces the income from sun rays. Assessing the impact of the oceans is much more complex. They can cool down the atmosphere whithin a very short period of time, because they only have an average temperature of approx. + 4 ° C (39 ° F). Human activities at sea can cause massive shifts in the short and long term. Science is not very interested in this and knows very little about whether humans have contributed to global warming or cooling phases over the oceans in the past 150 years. More on that later.
Many historical events, still little understood.
The latest news on volcanic impact is: “new evidence that a period of extreme cold in ancient Rome with an unlikely source: a massive eruption of Alaska’s Okmok volcano (43 BC)”, HERE . The following two millenniums showed considerable variations. In some cases it is evident that volcanoes caused the cooling, but numerous remain without explanation.
In 1895 the New York Times (NYT, Feb. 24) expressed concern about the “Prospects Of Another Glacial Period”, subtitled; “Geologists Think the World May Be Frozen Up Again”.
The article mentions, inter alia, that in 860 and 1234 ice formed a secure bridge from Venice to the opposite Dalmatian coast. In 1709 the Adriatic was completely covered with ice. All rivers in France were frozen in the years 1305 and 1364, in some places 15 feet (4.57m) thick. The winter of 1788/9 was rigorous throughout Europe. A similar situation emerged at the onset of the Second World War. Suddenly Central- and Northern Europe plunge in three of the coldest winters for 100 years, followed by a global cooling until the mid-1970s. The most likely causes are changes to the sea, but science offers little explanation.
Too obvious is the cooling threat related to many volcanic events. The TAMBORA (1812) for its extreme degree of cold, causing in 1816 the “year without a summer”, while in New England snow fell in every months throughout the year (NYT). The next event, a devastating effect on modern civilization, was volcano KRAKATOA (1883). Such an event today again, most of the aviation would be grounded for 3-4 years, and a serious cooling inevitable. During the years 1884 to 1886, inner-continental regions cooled more than coastal areas, indication the heating-potential of the oceans, even if sun-radiation reaching the earth surfaced is reduced. More: HERE and HERE.
Cooling is inevitable
The pervious listing of events is an indicator that regional or global cooling can occur at any time. Even if one ignores the last 2000 years, the earth used to be a much, very much colder place during the last 500K years (see: Fig. on the right). How little temperature decrees we need to get in big trouble can been seen by the developments after TAMBORA, The surface temperature anomalies during the summers: 1816, the “year without a summer” were −0.51 °C (−0.92 °F); summer 1817, −0.44 °C (−0.79 °F), and summer 1818, −0.29 °C (−0.52 °F). During the northern hemisphere summer of 1816, cooling directly or indirectly shall have caused 90,000 deaths.
Although the statistical deviation seem remote, but having an effect, succeeding many pandemics. The data from the Vostok Ice Core (Fig. obove right) had been very much colder over a half-million years.
Even if it is clear that humans have no way to prevent sun fluctuations and the occurrence of volcanic eruptions, the world needs a plan B and preparations for regional and global cooling.
Human made warming or cooling?
While the scientific community is only discussing human made warming, does not mean that human caused cooling does not excites. The sources of concern are human activities at and in the sea. If the water temperatures in the North- and Baltic Sea increase considerably more than elsewhere, it is at least grossly negligent, not investing heavily in research to find out why. Since industrialization these semi-enclosed waters a subject to huge human activities, with shipping, fishing and more recently off-shore windfarms. Huge water masses are churned around every day. The sea surface may be cooler during the summer season, but warmer in winter and spring, resulting in a net warming. (see a detailed assessment: HERE.
On the other hand, a lasting heavy human impact at sea, over several months or years, can lead to a regional cooling in Europe as during the winters 1939/40, 1940/41 and 1941/42, and a global cooling subsequently until the mid.1970s. More: HERE. During the Second World War, the weather was documented many folds higher than any time before. It was the longest cold period after the end if the Little Ice Age around 1850. Until now the reason for the three decades cooling period has been neither thoroughly investigated nor explained. With the billions spend in climatic research since long the impact of shipping and other activities at sea on global warming since the later 19th Century should have been done since long. But not one dollar has ever been spent. It is difficult to consider this not as a shocking failure of climate sciences.
Conclusion
Ignorance, incompetence and arrogant is not a crime. But it was easy to show that wide openness is required if atmospheric temperature changes are at stake. Human behavior can influence the direction, warming them up or cooling them down. A major failure, if not tragic irresponsibility, however is, if one of the inevitable possible events, warm or cold, is completely ignored. Not planning for this and not having Plan B is grossly negligent and could, one day, be classified as a “climate crime”. The current pandemic (see above) is evident for too little pre-preparation.
Weather and climate are everyday
slang words and
misleading when used by science.
By Dr.Arnd Bernaerts; Posted 22nd December 2019
During the last half of the Century the world has a big problem. Science abuses the laymen terms used since time immemorial: weather and climate. Every term is connected closer to every body than their shirts, 24/7 throughout their lives. Alexander von Humboldt (1769 –1859), the great German naturalist and geographer defined climate as ‘all the changes in the atmosphere that perceptibly affect our organs’. According A.v.Humboldt, ‘climate’ was even closer to the skin of any person than their dresses were during day and night. The intellectuals those days lived closer to nature than academics nowadays.
There are probably few people who can explain how the climate affects their organs, but they presumably would agree, describing the aspect as follows: :
Climate is the imaginary idea of an individual person from a possible state of the atmosphere, at one place or in one region, about a shorter or longer period of time from own experience or narrative of others or e.g. out of Guidebooks. This means: More than 5 billion adults are living on Earth. Everyone has their own view of climate and describes it corresponding to his own ideas, for the moment or the given circumstances.
Further Reading (amended 25. Jan. 2020): Everyone has their own view of the weather and climate! У каждого свой взгляд на погоду и климат! HERE
The earliest notions of climate were linked with latitude and astronomy. A. v. Humboldt’s analysis was close to ancient thinking. Antecedents of the concept of climate can be found in Greece by Hippocratic writers, focusing on seasonal change, influencing the occurrence of disease. The Hippocratic treatise “Airs, waters, places” (~400 BC) associates season, prevailing winds, and the quality of the air and water with the physical condition of people’, (More HERE).
During A. v. Humboldt’s lifetime, meteorology was emerging and still at a low level. Now for more than 100 years acknowledged as an academic discipline, scientists remained incapable to tell what ‘climate’ is, respectively formulate terms, which indicate incompetence, explaining nothing, and are completely useless in scientific research. In the early 20th Century climate was defined as average weather and in the 1930th the thirty-year period from 1901 to 1930 considered as the baseline for measuring climate fluctuations. Several decades later the prominent meteorologist H.H. Lamp regarded the definition of climate as “average weather” quite inadequate, mentioning that until recently climatology was generally regarded as the mere dry-as-dust bookkeeping end of meteorology (FN. 1). Also the either well-known F. Kenneth Hare wrote in 1979: You hardly heard the word climate professionally in the 1940s. It was a layman’s word. Climatologists were the halt and the lame (FN. 2).
It is naive not to realize that if you define climate as average weather, you have to say clearly what weather is. Weather has to be defined first. Meteorology has always ignored this point or – meanwhile – making nebulous statements about it.
Before we come to the layman’s term weather, let’s first view how science currently define climate. The internationally accepted authority on climate change, the Intergovernmental Panel on Climate (IPCC), turns the meaningless “average weather” into an inflated nonsense, namely, according its Glossary:
Climate in a narrow sense is usually defined as the average weather, or more rigorously, as the statistical description in terms of the mean and variability of relevant quantities over a period of time ranging from months to thousands or millions of years. (cont.)
There is no other explanation for such a junk than crazy. It is completely unusable as a work base in scientific research, and misleading in any communication with the public and governments. As a daily slang word, which is close to everybodys’s skin than its shirt, it is an abuse every time a scientist is using it. This is presumably a major reason that the climate-change debate has been getting more and more hysterical during the last decades.
But the story gets even worse, completey preposterous, when asking how IPCC defines “weather”. The result is shocking; the Glossary of IPCC offers nothing. But IPCC and other institutions, like the recent UN Climate Change Conference COP 25 (2 – 13 December 2019) in Madrid, do not care.
Even the definition of weather in the AMS – Glossary (American Meteorological Society) does not provide a usable solution, by explaining that __ Popularly, weather is thought of in terms of temperature, humidity, precipitation, cloudiness, visibility, and wind, and __ the “present weather” table consists of 100 possible conditions, and __ the “past weather”; of 10 possible conditions.
The AMS Glossary does not clear the matter, as it is superficial on several aspects. Already false is the explanation of ‘popularly weather’. The layman is able to use and explain the current weather in presumably several hundred versions, and ‘popularly weather’ is extremly far awayfrom a transparent and workable academic term, as explained above. Either the distinction between present and past weather is nonsense: Weather is weather, and statistic on atmospheric conditions, whereas numerical data, whether collected in the present or in the past remain a statistic. Once statistic always statistic. Not naming the ‘possible conditions’, nor the time period make it worse. Only the first sentence of the AMS weather definition is acceptable, saying:
Weather is the state of the atmosphere, mainly with respect to its effects upon life and human activities.
Actually it is fair to say that the layman understanding and use of the word of weather is closer to the following description:
Weather is a personal rating by any person over the condition of the atmosphere, in its various manifestations, at a certain time, usually for the current situation or in temporal proximity.
With such an explanation the story is close to the understanding in ancient Greek, and how A. v. Humboldt (1769 –1859) approached the matter. The story of the complete incompetence of the scientific terminolog does not end at this point, but it makes little sense to discuss scientific terminologies, which are at best a joke and belong in the garbage heap.
The failure of science is that it uses layperson terms, but cannot define them transparently. No wonder that there now are the movements ‘Fridays for Future’ and ‘Extinction Rebellion’, and a discussion at a hysterical level. But science seems happy with the situation, which they have caused. Their prominence grows, the money is coming in; they are able to influence long term political decisions. The biggest tragedy in the whole scenario is that the undeniable rise in temperatures since the mid-19th Century, is discussed on the most basic level.
Folks, keep your way of using the terms: weather and climate, as you did ever since, and do not allow science to abuse them for selfish reason.
Footnote 1): H.H. Lamb, “The New Look of Climatology”, NATURE, Vol. 223, September 20, 1969, pp.1209ff;
Footnote 2): F. Kenneth Hare, 1979; „The Vaulting of Intellectual Barriers: The Madison Thrust in Climatology“, Bulletin American Meteorological Society, Vol. 60, 1979, p. 1171 – 1174
By this failure, they lie to themselves and to the public
Posted: July 20, 2019, by Dr. Arnd Bernaerts, Translation from www.ozeanklima.de,
Amended: 25 July
The English philosopher John Locke stated 350 years ago: The achievement of human knowledge is often hampered by the use of words without fixed meaning. This is now the case in the so-called climate debate.
Science uses layman’s terms, which are completely useless in scientific work. Thus, lying to themselves and pretending to politicians and to the public that they understand what they are talking about, namely weather and climate. This has dramatic consequences, as the student demonstrations show on many Fridays in the past months. No one seriously denies that the air temperatures have been rising in the last 150 years. This can generally be summarized under “global warming”, if one generously ignores the two major temperature changes from 1918 to 1939 (increased warming) and 1940 to 1975 (strong cooling). Both events are strongly correlated to the big naval wars, 100 and 80 years ago, as prima facie proven HERE. The simple truth is that temperature changes and climate changes are not the same. Between layman’s weather and what science understands as such they are worlds apart. An overview is shown by the image – right hand, enlarged, below.
As long as this untenable situation was predominantly discussed by scientists and politicians among themselves, this has been long and unpleasant story. Now it becomes dramatic, when this incompetence of science extends to the youth. Science let them talk about climate, although they themselves cannot explain it in a reasonable manner.
The result is by now best known by Fridays for Future (FFF) movement, initiated by the 16-year-old Swedish activist Greta Thunberg, mobilizing 100 thousand children in over 100 countries with school strikes on Fridays. As her protest drew attention, she attended a United Nations climate conference in last December in Poland, where she criticized negotiators. “You are not mature enough to tell it like it is,” she said. “Even that burden you leave to us children”, reported the NYT in March.
Moreover, 23,000 scientists in Europe support her, by claiming that the demonstrating children “are helping science to wrap such an abstract and seemingly far-removed problem like climate change into a narrative”, asserted the Frankfurter Allgemeine Zeitung on 15. March 2019. Some scientists did not shy away from quoting: “We are the pros“, and: “The young generation is right“, so Volker Quaschning, Professor of Regenerative Energy at the University of Applied Sciences in Berlin. “The climate professionals are clear on the side of the students!” (as previous quote).
Hopefully, ‘someone’ will soon take action to protect the world from a science that is not even able to concretely describe whereof it is researching and unable to define the most important terms it uses, namely weather and climate. Indoctrinating children and pupils with scientifically unsubstantial words is totally unacceptable.
“Pupils take to the streets because the politicians, despite of nice words, miss the climate targets”, writes the climate researcher Stefan Rahmstorf from the Potsdam Institute for Climate Impact Research. CO2 reduction can be a target; “climate targets” is cheer nonsense!
This is irresponsible. The incompetent use of laymen’s terms must be thoroughly discussed and be reconsidered. Science has to show that it is able to define what it is talking about and claims to understand. The “use of words without fixed meaning” in environmental research must find an end.
Let’s face it. Except on some religious and faith expressions, the word climate has managed to become the most magical common term in modern time. Our previous post explained, that the word has a several thousand year’s history, but, during the last few decades, science uses it as ‘it fits best’ to underline the impression of competence, and in a similar way to scare the public and politicians alike.
Let’s face it. For any layman, weather and climate are individual and emotional terms, accompanying him any hour on every day throughout his life. A few or several weather conditions may have an impact on what to eat or drink, what to wear, how to go to work or on a walk, which gardening to do, what hat to put on, or sun cream to use, and so on. In the layman’s world, climate is merely a summary or a few aspects of weather condition in a certain location and time period, which may exist when planning a work trip to Anchorage in December, or holidays in Malta or South Africa next spring.
Let’s face it. Science, meteorology and climatology presumably understand something of the one hundred conditions composing the atmosphere currently, and also fairly correctly few days ahead, commonly called weather. Is this already the end of any consensus on the importance of weather and climate between the lay world and science?
Yes, with regard to weather! Not one ordinary man would ever see his “present weather as consisting of 100 possible conditions” (see AMS-definition, Fig. below).
Definitely yes, with regard to climate! The layman’s term is neither based on numerical statistics, nor would he ever consider “the mean and variability of relevant quantities over a period of time ranging from months to thousands or millions of years, (see IPCC-definition, Fig. below).
Let’s face it. The way the lay world understands and is using the words weather and climate is very different from the way science defines them and is presenting them in their scientific work to the general public. That they not even show any capability or willingness to see the huge discrepancy is a serious obstacle in a fair and fruitful climatic debate.
Let’s face the fact. Science seems happy to use floppy definitions, if at all. Although the UNFCCC (Climate Change Convention, 1992) is soon getting 30 years old, one never could hear any complain, that the most fundamental terms weather and climate are not defined, although numerous essays have been written on the subject. Here are few essays analyzed about the term and processing of the UNFCCC:
Let’s face the fact. Science seems to have little interest in listening and learning, as the following example indicates. Ten years ago, 18 of the most notable U.S. research organizations wrote an open letter to the Senators (AMS et al.-letter) dated October 21, 2009, writing –inter alias – excerpts:
___As you consider climate change legislation, we, as leaders of scientific organizations, write to state the consensus scientific view.
___climate change is occurring
___climate change will have broad impacts on society
___ severity of climate change
___We in the scientific community offer our assistance to inform your deliberations as you seek to address the impacts of climate change.
In the letter of 236 words, ‘climate change’ appears seven times.
This letter got a reply by surface mail and online about three weeks later, dated November 12, 2009 (AB-letter), expressing –inter alias- following concern (excerpts):
___ How could it happen that more than a dozen of the most prestigious scientific associations signed and submitted this letter on ‘climate change’ without having ensured that the used terminology is sufficiently defined. Good science can and is required to work with reasonable terms and explanations.
___ Actually nowadays climate is still defined as average weather, which may be fine for the general public, but nonsense as scientific term.
___ Article 1 of the FCCC providing definitions offers none on the term “climate”, and if it had been based on the common explanation on “average weather”, the word “weather” would have required a definition as well.
___ If your organization believes that “rigorous scientific research demonstrates that the greenhouse gases emitted by human activities“ has an impact on air temperatures, then any alert should be restricted to this aspect.
Nothing has changed ever since.
By the way. The two open letters were posted by the website “The Air Vent – Because the world needs another opinion”by Jeff Id on November 13, 2009. Few days later, the infamous hacker FOIA provided in comment No.10 a link to more than 1,000 emails and 3,000 other documents from the Climatic Research Unit from the University of East Anglia (UK). Did FOIA endorsed with his selection of the Jeff-Id post also concern with the climate definition?
No one knows. FOIA was never identified.
But “Climate Gate” (see: Wikipedia) took its course.
Has the climate debate turned into a horror scenario because
climate means anything and nothing?
Posted: April 17, 2019,
John Locke: “The achievement of human knowledge is often hampered by the use of words without fixed signification” British philosopher, 1632-1704.
For years, one can hear it daily. Climate change is the greatest threat facing our world. Few declare the debate as hoax, like U.S. President Donald Trump, others regard it as real, respectively as an issue that affects the whole of humanity, the future of humans depending on it. As long as only the rise of local or global air temperature is viewed, this is certainly correct. But that is rarely the case. Overwhelmingly all refer primarily to a threat by climate change, which is a distinct issue from a rise of air temperatures. Indiscriminating use of both term simultaneously is a fretful failure, leading to misinformation, disguising, and, if intentionally, a gross delusion. In the way science has been using the word climate over the last decades, the general public and politics is misguided since long. The reason is that science has been incapable to demonstrate that they understand what climate is, and able to define the terms they work with. Actually they use a layman term, broadly understood as average weather (for example the summer season in Florida), as greatest threat facing our world by calling it “climate change”. That is irresponsible and in an objective sense delusion. Let’s have a look at the term climate as used by science and climatology.
The misery of the climate discussion already arises with the statement: Weather is not Climate. There are many various around, but topped by a title/sub-title in scientificamerican (Sept.04,2018) saying: “Don’t Be Fooled: Weather Is Not Climate. But climate affects weather, [respectively]: Weather is affected by climate”. There is also the following quote:
Summing up the distinction between short-term changes in the weather and long term climate trends ……, Dr. J. Marshall Shepherd, President of the American Meteorological Society, used nine simple words: “weather is your mood and climate is your personality.”
Nothing is explained with such comments. They cause confusion and are nothing more than babble. That stems from the fact that weather is a physical state of the atmosphere, and climate merely the numerical statistic of numerous aspects of this state. While the former situation exists for a very short moment only, never repeating again, the latter is a huge amount of numbers and can never convert to weather again. It is therefore horrible when it is said: climate affects weather. How can any statistic influence the physical condition of the atmosphere?
Unfortunately, this is not just a slip-up, but runs through all the definitions that science uses for weather and climate. Since modern climatology claims to be abler to advise the general public and governments on climate change since about the 1980s, their ability to formulate what they are talking about was remote, if existing at all. Let’s start in 1992, before discussing briefly the background of the term: climate.
UNFCCC
In 1992, the Rio Conference adopted the UNITED NATIONS FRAMEWORK CONVENTION ON CLIMATE CHANGE, UNFCCC. Although the word climate is included in the title, the convention offers not any explanation at all. Similar shocking is not to realize that if one wants to explain “climate change” that it is a paramount condition to say what the subject of change shall be. This nonsense is topped when saying: “‘Climate change’ means a change of climate…” (More details see Fig. left). According the Dictionary of GLOBAL CLIMATE CHANGE (1992) by W. John Mauder, (pp. 240):
Climate is the synthesis of the day-to-day weather conditions in a given area. The actual climate is characterized by long-term statistics (such as mean values, variances, probabilities of extreme values) of the state of the atmosphere in that area, or of the meteorological elements in that area(more Fig. 2). [W.J. Mauder – New Zealand – was for many years Vice- and President of the WMO Commission for Climatology].
This definition is in no way a substitute for the gap left by the UNFCCC. Even the quality of the first sentence can be questioned, as subsequently “actual climate”, and other issues mentioned.
IPCC – Climate
The most proeminent institutions on climate are the Intergovernmental Panel on Climate Change (IPCC) and the American Meteorological Society (AMC). Today they have both lengthy glossaries with more than 12,000 terms (AMS), or over 52 pages (IPCC) respectively. Remarkable – they are both concerning the term climate. On one hand, they differ extremely from each other. On the other hand, each text on climate is at best a joke as an academically reasonable definition. They are both useless in the field of scientific work, and of such big lack of clarity that they undermine any fair and explanatory communication between the general public and politics.
The IPCC definition starts with the confession that there is no better idea than to repeat the layman expression since ancient times: climate is average weather. (see Fig. 3). At least one would assume that the IPCC Glossary would tell the reader now what is weather, or how average weather is defined, but the Glossary is completely silent on it. The subsequent attempt to describe climate (more rigorously), as the statistical description in terms of the mean and variability of relevant quantities over a period of time ranging from months to thousands or millions of years, can only be called as naive. What “terms of the mean and variability” shall be used? What are relevant quantities? The text of the definition lose any ability as a working tool, when the so called ‘classical period’ 30 years is replace by a range ‘from months to thousands or millions of years’. Such a definition is completely useless, which commence with the use of the word weather, which is primarily an individual impression and experience of any person alive, and there are many.
Back in 1987 the WMO Bulletin published the following definition (Fig. 4):
Climate is the statistical probability of the occurrence of various states of the atmosphere over a given region during a given calendar period;
Weather is the state of the atmosphere over one given region during one given period (minute, hour, day, month, season, year, decade, etc.).
From the many ambiguities the text has, the most obvious is that ‘weather’ shall also comprise the state of the atmosphere over years and decades. What demonstrates better than anything else that the author did not understand what he was talking about? See the Fig. 5, 6, & 7.
The First IPCC Report, June 1990, didn’t made any use of the WMO publication five years earlier, but in the Introduction (p. vii) merely said:
___A simple definition of climate is the average weather. ___A description of climate over a period (which may typically be from a few years to a few centuries) involves the averages of appropriate components of the weather over that period, together with the statistical variations of those components. ___The driving force for weather and climate is energy from the Sun.
Although there is frequently a reference to weather, the Introduction (as presumably the entire Report, total pages 365) offers nothing, as the current IPCC Glossary. In the published edition by J.T. Houghton et al, 1990, Cambridge University Press the cited text is on page xxxv & xxxvi.
Almost 30 years later, nothing has changed for better. A layman term was abused to scare the public than, while no effort was spared to increase the pressure ever since.
For more, see the following discussion about AMS definition on climate and weather.
AMS – Climate & Weather
The AMS Glossary offers a different approach. The definition begins with the sentence: “climate is the slowly varying aspects of the atmosphere–hydrosphere–land surface system”, see full text Fig. 8. It is all the Glossary tells about the meaning of climate. It is virtually impossible to make any sense out of it. A definition of ‘nature’ could go equally. All that this boils down to is ‘the interactions of the natural system’,
see: Letter to the Editor, NATURE 1992, Vol. 360, p. 292
The subsequent sentence no longer refers to climate, but to the ‘climate system’ a term “typically characterized in terms of suitable averages over periods of a month or more”, which is separately defined as:
climate system The system, consisting of the atmosphere, hydrosphere, lithosphere, and biosphere, determining the earth’s climate as the result of mutual interactions and responses to external influences (forcing). Physical, chemical, and biological processes are involved in the interactions among the components of the climate system. http://glossary.ametsoc.org/wiki/Climate_system
Also the next about 70 words contribute little to make the term a reliable asset. The only interesting aspect is, that the AMS climate definition back off using such terms as ‘average weather’, ‘statistical description’, or ‘relevant quantities’, but explains nothing, and says practically the same as the explanation of the ‘climate system’.
But different from IPCC the AMS Glossary defines weather (Fig. 9). Interesting that the first paragraph confirms what was already said above, that weather is “primarily an individual impression and experience”, namely:
WEATHER is „The state of the atmosphere, mainly with respect to its effects upon life and human activities.”
But the definition runs afoul and inconsistently immediately when the next two sentences state:
As distinguished from climate, weather consists of the short-term (minutes to days) variations in the atmosphere. Question: Where is the 1st and 2nd sentence compatible?
Popularly, weather is thought of in terms of temperature, humidity, precipitation, cloudiness, visibility, and wind.
Question: What has this distraction (popularly) to do in a scientific definition? On the other hand, it
confirms that also “weather” is primarily a layman term.
How inconsequently also the AMS weather definition has been drafted comes to light if it describes that
The “present weather” table consists of 100 possible conditions, with 10 possibilities for “past weather”; both are encoded numerically.
This shows evidently that also AMS has no definition of weather, but uses the word as it fits best. Five conditions here, 12 conditions there and thereon called climate. But weather is weather and cannot consist one time of 100 conditions, and if convenient for making a case consist of 3 conditions. Not surprisingly “future weather” is not mentioned.
Climate is a layman term – A short background
The concept of climate can be found in Greece in fifth century BC. To Hippocrates of Kos (~460 – ~370 BC) it comprised airs, waters, places associates season, prevailing winds, and the quality of the air and water with the physical condition of people. The earliest notions of ‘klimat’ were linked to sun inclination, and latitude. Over 2000 years the term climate is a solid public domain. Like weather, the word reflects a general impression. People not necessarily like to talk about climate and weather, but need to find out, which issues are needed to have an informative conversation, e.g. temperature, sun shine, rain, wind, etc. In countries with quickly changing weather conditions, as in Western Europe, the talks on weather are more intensive and lengthy, as in the Sahara with little changes. It is more abstract when merely seasonal conditions for a holiday abroad, for example in Morocco in May is of interest, commonly called climate.
During the last several century philosophers, writers and researchers used the term climate as well. For example the German naturalist and geographer A. von Humboldt (1769 –1859) defined climate as “all the changes in the atmosphere that perceptibly affect our organs”. But none could be called a climatologist, as that term came into use only well after World War II. At best the term ‘climate’ existed in the layman’s way. The preface of the book by V. Conrad (1946): Methods in Climatology. Harvard University Press; pages 228, states in the first and last paragraph (p. vii):
Climate influences the surface of the earth, and this conversely, in its conditions. This intimate mutual connection makes climatology and climatography appear as parts of geography, because they are essentially necessary to describe the surface of the earth and its changes. These ideas find their expression in the fact that generally the colleges and universities, climatology as a whole is treated in the geographical departments. Perhaps the dependent role of climatology may be attributed also to the fact that geographers have so greatly furthered this science.
The general introduction presents climatology as a world science, and its international organization. The number of observations in the meteorological register makes the necessity of statistical methods evident.
Until the end of the 1940s, only the number of observations and statistical methods were of interest. Prominent meteorologist confirmed few decades later, that the term climate was rarely used
H.H. Lamp (Nature, Vol. 223, 1969): Only thirty years ago climatology was generally regarded as the mere dry-as-dust bookkeeping end of meteorology. Definitions of climate and climatology have varied. That (still widely) definition of climate as “average weather” must surely be regarded as quite inadequate. Climate comprises the totality of weather experienced at a given place.
Kenneth Hare, (Bulletin American Meteorological Society, Vol. 60, 1979); This is obviously the decade in which climate is coming into its own. You hardly heard the word professionally in the 1940s. It was a layman’s word. Climatologists were the halt and the lame. And as for the climatologists in public service, in the British service you actually, had to be medically disabled in order to get into the climatological division! Climatology was a menial occupation that came on the pecking scale somewhat below the advertising profession. It was clearly not the age of climate.
Meanwhile efforts are made to present climate and climatology as a long standing interest of science, at least for the last 150 years. For example Roger G. Barry (in Int. J. Climatol., Vol. 33, 2013), is saying: “The term climate has a 600-year history, but only came into widespread use about 150 years ago.” The crux with such a statement is, that the entire assessment is based on the layman term: “climate is average weather”, which is “surely quite inadequate” as H.H. Lamp observed back in 1969 (see above). But still in 2019 IPCC rely on it (Fig. 3), and AMS evade this point by talking instead of the ‘climate system’, see discussion above and Fig. 4.
What should be the conclusion? A science which is not able to define in a clear and understandable manner, what they are talking about, does not deserve being recognized as a competent academic discipline.
The use of words that are of ’emotional importance’ to the public must be clear, reasonable, and comprehensible. Otherwise, there is a danger that it may come to an objective deception. The debate on climate change does not meet John Locke (1632-1704) requirement of using only terms with “fixed signification”.
Is there a solution? Yes, by recognizing that the ocean is the base of the weather,
while sticking to the fact that any statistic always remains a statistic!
If one regards the words weather and climate primarily as an individual impression and experience of any person, respectively of emotional importance to the public, one should leave it in the public domain. Furthermore it seems most unlikely, that the terms can reasonably define in an academic manner, which would require a wording that does not mix-up with any layman understanding. But if the term Climate shall be used, not the weather but the oceans must be the centerpiece of the definition.
Already back in 1984 J. D. Woods explained the role of the ocean in the planetary system (excerpts):
Approximately 80% of solar energy intercepted by our planet enters the atmosphere over the oceans. About 50% of this energy flux reaches the bottom of the atmosphere after 25% has been reflected by, and 19% absorbed in the atmosphere. Neglecting atmosphere bias between continental and ocean regions, the oceans receive 40%, and the continents 10% of the intercepted energy. …The ocean is the principal initial receipiet of energy entering the planetary climate system…. Almost all of this radiative flux into the ocean is absorbed in the top 100 m. (cont,//) [in The Global Climate, Cambridge (Uni.Press), 1984, p. 142.]¸ see also Fig. 10
The ultimate source in the planetary scenario is water, of which is only a very small percentage in the atmosphere. At any moment, the atmosphere contains only the amount of water, which would cover the entire surface of the Earth (land and ocean) with as little rain as one inch (2,5 cm) only. The water volume of the ocean is 1000 times bigger, and has only a mean temperature of about +4° Celsius. The huge stability of the oceans over long periods of time is amazing, but even minor change in current status of the ocean, will make the rising air temperature discussion any greenhouse discussion looking much too narrow. It is high time that any definition in this respect needs to acknowledge that the current and future planetary weather system depends on the oceans, or briefly: Oceans Govern Climate.
The Arctic has still many secrets, one is the warming that started 1918
Post: April 08, 2019, with reprint from NASA Earth Observatory (below)
Today the NASA Earth Observatory published an image-of-the-day the Vaviloc Ice Cap on an island in the Kara Sea. That is high in the North, at 79°30′N 97°00′E, and well in the Arctic region. Adam Voiland provided an interesting text citing two scientists and their considerations concerning the possible demise of this ice cap (full text below). But is it of any help?
No! Instead of elaborating on the sea water conditions in the Kara Sea during the last 100 years, the speculation simply goes by saying: ““It may be that they can respond more quickly to warming climate or changes at their bases than we have thought.” That hardly more informative as a recent statement which tries to explain the arctic warming in the 1920s says: “Needless to say, a necessary condition for the Arctic warming event to happen depends on the change in the larger scale atmospheric circulation”[ Lennart Bengtsson, Vladimir A. Semenov, Ola M. Johannessen, The Early Twentieth-Century Warming in the Arctic—A Possible Mechanism, Journal of Climate, October 2004, page 4045-4057] More HERE.
Since Fridjof Nansen FRAM expedition 1893-96 (Fig. 1) it is know that the cold sea surface layer in the area was thinning. That remained a slow process until the end of the Great War (1914-1918). Since winter 1918 the temperatures in the European sector of the Arctic “exploded”, lasting until World War II started in September 1939. A few Figures indicate the extreme increase in the Arctic region from the North Atlantic to the Kara Sea clearly, see Fig. 2-5. Merely talking about a “warming climate” or a “larger scale atmospheric circulation” is not enough. More than 100 years Artic research seems incapable to realize, that climate research in the Arctic has to start with sound information from the sea surface to the sea bottom. For more information see the book at: http://www.arctic-heats-up.com
An outlet glacier in the Russian High Arctic has scientists rethinking how rapidly glaciers in cold, dry areas can move. Text by Adam Voiland
Glaciologists generally classify glaciers into two major types. In temperate areas, where summers are relatively warm and plenty of snow falls, warm-based glaciers dominate. This type slides easily, often slipping a few kilometers each year because water lubricates the ground and the base of the glacier. In contrast, cold-based glaciers dominate in polar deserts—the cold, high-latitude areas that receive little snow or rain. This type of ice generally stays fixed in place, rarely moving more than a few meters per year.
When a cold-based glacier in the Russian High Arctic began sliding at a breakneck pace in 2013, University of Colorado Boulder glaciologist Michael Willis was mystified. After moving quite slowly for decades, the outlet glacier of Vavilov Ice Cap began sliding dozens of times faster than is typical. The ice moved fast enough for the fan-shaped edge of the glacier to protrude from an ice cap on October Revolution Island and spread widely across the Kara Sea.
“The fact that an apparently stable, cold-based glacier suddenly went from moving 20 meters per year to 20 meters per day was extremely unusual, perhaps unprecedented,” said Willis. “The numbers here are simply nuts. Before this happened, as far as I knew, cold-based glaciers simply didn’t do that…couldn’t do that.”
Landsat satellites have been collecting imagery of the glacier for decades. A time-lapse video, which begins with imagery acquired in 1985, showed the terminus creeping forward between 2000 and 2013, but at a modest pace—just enough for a tongue of ice to begin pushing into the Kara Sea. After 2013, the glacier sprang forward, accelerating rapidly. By 2018, the glacier’s ice shelf (where the tongue stretches over the water) had more than doubled. Meanwhile on land, the ice had thinned noticeably, particularly around the edges. (Note that in the images above, the blue areas in the Kara Sea are sea ice, not glacial ice.)
Willis and his colleagues are still piecing together what triggered such a dramatic surge. They suspect that marine sediments immediately offshore are unusually slippery, perhaps containing clay. Also, water must have somehow found its way under the land-based part of the glacier, reducing friction and priming the ice to slide. Observations from several satellites suggests that the northern and southern edges of the glacial tongue are grounded on the sea bottom, while the middle is probably floating, another factor that has made it easier for ice to push forward at a rapid rate.
The sudden surge raises questions about the future of Vavilov Ice Cap. Though the glacier’s pace slowed somewhat in 2018, it has sped up again in 2019. “If this continues, we could be witnessing the demise of this ice cap,” said Willis. “Already, Vavilov has thinned enough that snow has stopped accumulating on its upper reaches, and it is a small ice cap in the first place.”
Hundreds of cold-based glaciers line the coasts of Greenland, Antarctica, and islands in the high Arctic. Together they cover hundreds of thousands of square kilometers of land. The events at Vavilov suggest that these glaciers may be less stable and resilient and more capable of collapsing and affecting sea level.
“This event has forced us to rethink how cold-based glaciers work,” Willis said. “It may be that they can respond more quickly to warming climate or changes at their bases than we have thought.”
NASA Earth Observatory images by Lauren Dauphin and Joshua Stevens, using Landsat data from the U.S. Geological Survey and topographic information from the ArcticDEM Project at the Polar Geospatial Center, University of Minnesota. Story by Adam Voiland.
Contributed war in Europe reduced air moisture and subsequently extreme winter condition?
Posting: April 01, 2019
Cold winter spells in the U.S.A. and Canada are very common. This year was no exception. Before looking back to winter 1939/40, the first war winter in World War II, a brief review of the last winter in North America.
In late January 2019, a severe cold wave, caused by a weakened jet stream around the Arctic polar vortex, hit the Midwestern United States and Eastern Canada. It came after a winter storm brought up to 13 inches (33 cm) of snow in some regions from January 27–29, and brought the coldest temperatures in over 20 years to most locations in the affected region, including some all-time record lows. In early February, the polar vortex moved west, and became locked over Western Canada and the Western United States. As a result, February 2019 was among the coldest and snowiest on record in these regions. In early March, the cold once again shifted east, breaking records in many areas. In mid-March, the cold wave finally retreated, but combined with above-average temperatures, precipitation, and a deep snowpack, widespread flooding ensued in the Central US. (Source Wikipedia, 1st April 2019)
While meteorology will manage to run sufficient forecasts throughout the winter, one wonders that they have not explained what happened in autumn and winter 1939/40:
Record wetness month September 1939 in Arizona (see Fig.)
Record driest month in November 1939 in 9 States (see Fig.)
Record warmest month in December 1939 in 3 States (see Fig.)
Record coldest month in January 1940 in in 7 States (see Fig. 1
That was not a natural occurrence. In autumn, there was war in East Asia, and in Europe. Globally the northern Hemisphere was affected. At first, it rained more than in average. With less moisture in the air, subsequently came the cold. In Europe, it was the coldest for one century. In the South-East of the United States the coldest ever observed. The extraordinary conditions almost eight decades, should not be forgotten, but serve as reminder that events than were anthropogenic influenced. Even the smallest percentage contributed by human activities to the weather pattern in winter 1939/40 needs to be understood and discussed in the general debate on climate change. To serve this purpose, it follows an excerpt from the Book: “Failure of Meteorology”.
NOTE: Text and Figures are not necessarily identical, but shortened, altered or changed.
Did the war show an effect in the U.S. in autumn 1939 and January 1940?
Overview on the foreplay of a cold US January 1940
The fact that the first signs of a real winter emerged at Christmas time 1939 (NYT, Dec. 23, 1939) was presumably not worth a doctor’s thesis at any time. Neither that the winter earnestly came in early January 1940, with a frigid wave that gripped most of the United States (NYT, Jan. 6, 1940). Icy north-westerly winds swept over New York with force, on January 6, causing temperatures to drop to an average of 10 degrees Fahrenheit below normal. Frigid waves even touched northern parts of Florida (NYT, Jan. 07, 1940).
But the information by Dr. James Kimball, published in ‘The New York Times’ on January 7th, 1940, that November 1939 had been unusually dry, should have been investigated by science, or in a doctoral thesis, why that had happened, and whether military activities in China and Europe, and the increase of condensation nuclei had anything to do with it. The less humidity there is in the atmosphere, the more easily it can be replaced by colder air. If the amount of water in the atmosphere is less than average, the ‘vacuum’ thus created, needs to be filled by air. The fact that the Northern Hemisphere was in such a state towards the end of the year 1939 is very likely and science could have found out why long ago. The USA had been recorded as very dry in November and early December, which made it easy for Arctic air to travel south to filling up the gap. But it all started two months earlier.
A special September in California
In September 1939 the sun state had to cope with a number of weather caprioles. The unanswered question until today is what role an El Niño event had in that place at that time, and the contribution of war activities in China and Europe, due to the excessive release of condensation nuclei. Much too extraordinary and seldom was the situation that caused high precipitation during September with 370% above normal in California (Alabama, 119%; Arizona, 335%; Nevada 327%; Utah 261%).
California experienced an eight-day-long heat wave since about September 16th before a tropical storm, formerly a hurricane, hit Southern California, at San Pedro early on the 25th with winds of severe gale force. The up to 11 Beaufortstrong winds were the only tropical storm to make landfall in California in the twentieth century. The air pressure went down to 971 mb, and the excessive rain caused heavy flooding, e.g. September records in Los Angeles (5.24 inches in 24 hours) and at Mount Wilson, 295mm/11.60inches). It was the heaviest September rain in Los Angeles’ weather history and it broke the worst heat wave in Weather Bureau records, as measured by intensity and duration. (NYT, Sept.26,1939).
The scientific disinterest in investigating whether the exceptional conditions had been a reflex action in the atmosphere that reached North America from the French-German, or the Polish-German front in Europe, e.g. from thousands of planes in the air, from shelling and burning down Polish villages and Warsaw, or even from fighting in China is stunning. That El Niño had a stake in the issue will be hard to prove, as the air temperatures at the equatorial Pacific was neutral, if not in La Niña condition (see: Fig. below), and global temperature maps for Sept./Oct./Nov.1939, HERE). Further details: Chapter F(here: http://www.seaclimate.com/f/f.html ).
The driest November on record
Except for a few States in the east (see above), the fall season was extremely dry over large areas. For all the areas east of the Rocky Mountains it was the driest fall on record (Martin, 1939). For about 9 States it is the all-time record[3], TM5, and the dryness must have severely affected southern Canada as well. Time magazine titled on December 25th, 1939: “WEATHER: Driest Fall”, and reported “the driest fall on record, a severe case of spotted drought affecting 97,000,000 U.S.acres.”[4] About 16 States had less than 33% of their normal November precipitation.
The 1930s were famous for the ‘Dust Bowl’, during which severe dust storms caused agricultural damage to American and Canadian prairie lands. In some areas this phenomenon lasted until fall of 1939, when regular rainfall finally returned to the region.
After extreme amounts of precipitation in September and dryness in November (see above) December came along with another curiosity. The overall monthly temperature record was considerably above average (TM5). In three States the all-time record had been observed. In the east, a change was already expected for the beginning of the holiday season: “White Christmas is likely for city” (NYT, Dec. 23, 1939). It took a few days longer for winter to come. On the 28th, it was time to report: “A biting northerly, driving grey, snow-laden clouds before it, brought to New York yesterday the coldest day of the winter. Shortly before 10 A.M. the mercury dropped to 11.9°F above zero”(11°C), (NYT, Dec. 28). Soon in 1940 the “Winds sweep the city as cold grips the U.S. ”, with “a mark of 11°F below (-24°C) in Indiana (NYT, Jan. 07, 1940. An exceptionally cold January 1940 had reached the United States , as shown in Figure 1 (above)
Further north, in Canada, the situation was partly reverse, as Brooks (1940) explained in a paper only few months later:
“Paradoxically, most of eastern Canada north of latitude 48° was above normal, with temperatures ranging up to more than 25°F above normal north of latitude 58° and 18°F above normal in the interior of Alaska. Missouri was actually as cold as the Hudson Bay region for the month”.
Nowadays this constellation brings the question of an interrelation with El Niño conditions into play, which is done in Chapter F (here: http://www.seaclimate.com/f/f.html ).
Natural variation?
The Timing: The ‘timing’ between excessive rain in Europe and the dry months in the United States is a perfect indication of the relationship between both events. Any ‘interchange’ between dry and wet air takes its time. A dry or humid air body can exist from up to several days to a few weeks. An ‘air body’ needs a couple of weeks to circle the Northern Hemisphere. Scherhag (1951), analysed a disruption in the circulation of air in the winter of 1940, and states with regard to air movements that there must have been a subsequent air-body-transfer (“Massentransport”) from the Southern Hemisphere towards the Arctic, which means, that ‘dry air’ from Europe could have circled the globe for some time before a ‘humidity gap’ could be refilled. This also confirms that there was a ‘humidity gap’ in the first place. If the ‘dry-out’ had not been caused by military activities, what else could have caused it?
Record Warmest vs. Record Coldest: The fact that temperatures in December 1939 (see TM5) had been widely above normal, versus the observation that in the south-east of the U.S. recorded values were much below normal with eight States experiencing the coldest January on record should be enough reason to ask why, and to consider whether it had something to do with war activities elsewhere.
The Regions Covered: January 1940 was cold in all Northern Hemisphere regions, viz. North America, Northern Europe and Northern Asia. This is a strong indication that there was too little humidity in the air (as proven in the case of the USA – above), giving arctic air a free path to penetrate deep into southern regions.
Difference between the winters in the USA and Europe: a further piece of evidence is the fact that the severity of the winter in the United States was over by the end of January 1940 (Brooks, 1940), whereas extreme winter conditions prevailing in Northern Europe during February 1940 show that a number of countries, e.g. Holland, Northern Germany and Southern Scandinavia, experienced their coldest winter for more than a 100 years. According to TM4 (page 45) the south-east USA and Europe were likewise again cold during March and April 1940.
Lower air circulation: according to R. Scherhag (1951) the winter of 1939/40 was the result of a comprehensive general disruption of the atmospheric circulation, which could be regarded as a ‘prototype’ for a weakened circulation. Less humidity in the atmosphere and lower temperatures in seas and oceans, due to naval warfare in the waters of Northern Europe , inevitably caused disruptions in atmospheric air movements.
Is it possible to establish a connection with the war?
At this stage of the investigation, it is too early to give a definitive answer. Actually, this section only highlighted the aspect of rain and humidity, and gave a brief overview of the situation in the United States in autumn 1939 and January 1940. However, as long as there is not a more convincing explanation of what had caused the numerous observed deviations from the statistical mean in fall of 1939, the war in China and Europe is a serious option, and it is a more convincing work thesis rather than talking about meaningless “natural variations”. Anyway, timing is perfect, and far and wide, no other identifiable cause can be seen, at least not for the conditions in Europe .
The findings until now can be summarized as follows:
A number of indications show that the war in Europe and in China may have significantly influenced winter weather conditions over long distances. In this case, North America had a severely cold January in 1940. Most likely, it had been supported by a lack of usual rain in the United States during the months of October to December 1939, in the first place due to generating condensation nuclei by military activities in Asia, in Poland and along the Western Front in Europe. The obvious “rain forcing” in autumn 1939 that caused low humidity in the atmosphere, made it easy for arctic air to forcefully travel down to the mid-latitudes of the Northern Hemisphere. The timing of ‘dry air’ and the invasion of polar air over all NH continents suggest that this was not a mere natural variation. The drier the air properties at lower latitudes are, the easier arctic air can spread southwards. The lower maritime influence is (warm moist air), the more continental conditions will prevail (cold dry air). The Northern Hemisphere felt it with full force in January 1940. A severe winter, the coldest in one hundred years in countries bordering the most war-affected seas in Northern Europe, did not come ‘just out of the blue’, but it was a combination of too dry air circling the hemisphere and naval operations in the marine environment of Europe.
Do human activities at sea keep heavy cold at bay ?
Posted: 15th March 2019
The same procedure as last year, when the winter 2017/18 was here discussed as well, basically with the same text. In Europe’s winter are getting warmer at a pace faster than global average(Details HERE). The current winter proves it again. Whereas North America saw record braking freezing temperatures during the last months, Europe is spared of wintery weather until now. The most likely reason is increasing ocean use, particularly by off-shore windfarms and shipping, which churn the sea like moving spoon in a hot coffee pot. While climatology is not able to consider this mechanism, any cold from the Arctic or Siberia is kept at bay. That should have been common knowledge since long, at least since the commencing days of World War II.
Actually the story is simple. Since the Little Ice Age has ended around 1850, the world has been getting warmer. By the end of the 1930s the temperatures, particularly in the Norther Hemisphere, increased to level close to current values. That stopped abruptly during the first war winter 1939/40. The cause is to attribute to excessive ocean penetration due to naval warfare on a grand scale, bombs, sea mines, depth charges, many million shells, and thousands of vessels, navigating, fighting, mine-operation, surveillance, and training. However, the impact on the winter conditions than and today seems contradicting. Winter 1939/40 was in many locations the coldest for up to 200 years or ever recorded, while currently climatology will soon declare Europe’s winter 2017/18 the warmest ever. The tragic is that both cases have the same source, man-made climatic changes, but science does not know, and is unable to inform politics and the general public correctly.
The way man has contributed to the extreme climate conditions in winter 1939/40 and 2018/19 is based on the same physically-dynamic process. The starting point is the intake of heat during the summer season in the reginal seas around Europe, particularly in the North- and Baltic Sea, which will be released during the subsequent winter. This ‘natural’ process is meanwhile greatly enhanced by human activities. The more or the longer the atmosphere gets an extra heat input, the less any Arctic or Siberian cold will get a chance to govern the winter in Europe. But the stored heat is not unlimited. If the available heat is released too quickly, the result reverses. When reginal seas are cooled to ‘unusual levels’, Siberian icy cold air can easily travel to the Atlantic shore. That occurred in winter 1939/40, see Fig.2. Please check also the difference in sea ice conditions as shown in the various images.
The winter meanwhile 79 years ago, could easily explain how reginal climate works. One needs only to imagine the picture of a baby bath with too warm water to bath the baby. The water will be turned around until the temperature is right for the baby. The longer it is turned the colder it gets. Is it so difficult to acknowledge and apply the every day experience with a too hot soup? The warring naval forces did the same across the coastal seas in Europe. It took only four months, and the first WWII winter run amok. Ignoring the case entirely raises the question of gross negligence. WWII contributed to a global cooling from 1940 to the mid-1970s. Ocean uses in all its facets, is likely to have contributed to the global warming over the last 150 years. The vast installation of hundreds of off-shore windfarms during the last decade is certainly a contributing factor to the higher than the global warming of the seas around Europe. In the North and Baltic Seas temperatures increased five to six times faster than the global average over the past 25 years, and three times faster in the Black and Mediterranean Seas. (Related Essay in PDF) Science spend many billions to prove a correlation between CO2 and global warming, but not one cent on how shipping, fishing industry and naval activities in war time have influenced weather and climate conditions since the end of the Little Ice Age around 1850. Climate science behaves irresponsible.
How big is the human influence on the low sea ice?
Posting: March 03, 2019
This winter sea ice is shockingly low, practically not existing in early March 2019. Why is there such a big difference between now and the first three war winters 1939/40ff.
A previous post asked: “Europe winter free – Thank to off-shore windfarms” one year ago? Comparing the current sea ice conditions with those of long-term average, raise the curiosity even further. There is even less sea ice as a year ago. Two month ago, the Met-Off discussed the possibility of another “Beast from the East’ early in 2019?” This side commended:
“Please be prepared for further information and analysis on winter weather development then and now and whether it is acceptable for one of the leading meteorological services not to be interested and able to explain the weather events after four months of World War II.”
The beast did not come. The Siberian cold in Siberia did not build up, respectively the Atlantic cyclone-system too powerful to give any cold air from the Arctic or Serbia any chance to reach the western Atlantic shore, see the weather may of today and the nutshell-image.
Fact is that North- and Baltic Sea warm faster than any other sea area. (see Fig. 5), which means that they store more heat during the summer season and are able to release more during the winter season, paving the way an easy flow of cyclones from west to east. This has been extensively discussed HERE.
Neither should climate science ignore the higher warming of the sea in Norther Europe than elsewhere, even less should the do it with exceptional sea ice conditions 80 years ago, but take serious what Swedish sea-ice expert C.J. Oestman observed concerning he conditions in winter 1940:
The severe winter ice conditions, particularly the spread and thickness of sea ice extent, have again drawn great interest in the unusual cold of last winter, as well as the associated strong ice forming.
Oestman, C.J. (1941); ‘Isvintern 1940-41 – En jämförselse med 1939-40’, Statens Met-Hydro.
Anst., Meddelanden Ser. Uppsatser, No. 38, Stockholm, pp. 2-10.
At the end of his 25 page report he lists the severe winters during which the Swedish coast was entirely covered with ice. During the 70 years of regular observations it happened only eight times, five times between 1870/71 and 1892/93, and during the winter 1916/17, 1923/24 and 1939/40. A detailed analysis is HERE.
C.J. Oestman (op.cit.) already realized that the meteorological cause for the arctic conditions was:
“The highs (over North Europe), however supported a uniform inflow of cold air from northern Russia and Siberia, but blocked the way for mild air currents from the Atlantic and southern latitudes.”
What more does climate science need to investigate the role of man in the current warming of Europe’s winter, respectively the sudden and extraordinary cooling during the winters 1939/40. The sea-ice conditions would be an interesting part in any serious considerations.
It looks miraculous how easily some scientists show how ocean temperatures behave. But can it be taken seriously, if considering the vastness of the ocean, its low mean temperature (merely + 4°C), and its overriding impact on the global weather/climate system? Any research on global warming that pays nil attention to the possible impact of human activities at sea, and below the sea surface, should be received with great reservations.
Any research regarding the network of more than 3,800 robotic floats sufficient to calculate past and future overall ocean temperature trends since industrialization is very close to manipulation, but far away from understanding ocean matters. One needs only to take an assessment by the IPCC (2013) more serious, whereby “Ocean warming dominates the total energy change inventory, accounting for roughly 93% on average from 1971 to 2010 (high confidence)”, while concluding that the “Warming of the atmosphere makes up the remaining 1%.”
An article published last year in the journal Nature, describes a way to measure the average temperature of the ocean and to reconstruct past ocean temperatures. The abstract outlines that
that the mean global ocean temperature increased by 2.57 ± 0.24 degrees Celsius over the last glacial transition (20,000 to 10,000 years ago), and that
most of the anthropogenic heat added to the climate system has been taken up by the ocean up until now, its role in a century and beyond is uncertain.
“Our precision is about 0.2 ºC (0.4 ºF) now, and the warming of the past 50 years is only about 0.1 ºC,” he said, adding that advanced equipment can provide more precise measurements, allowing scientists to use this technique to track the current warming trend in the world’s oceans. Up to this point, the best estimates have come from the Argo program, a network of more than 3,800 robotic floats distributed around the world’s oceans that measures temperature and other properties and reports the data via satellite”
One can only wonder how little ‘feeling’ some scientists have about the aspect: Dimensions matter. Consider the following:
There is first of all the oceanic water volume versus those in the air. One estimate of the volume of water in the atmosphere at any one time is about 3,100 cubic miles (mi3) or 12,900 cubic kilometers (km3). That is only about 0.001 percent of the total Earth’s water volume of about 332,500,000 mi3 (1,385,000,000 km3. If all of the water in the atmosphere rained down at once, it would only cover the globe to a depth of 2.5 centimeters, about 1 inch. MORE
It seems very far-fetched referring under such circumstances to ‘natural variability’. If for example,Indrani Roy of the University of Exeter, (28.Sept.2918) to consider merely segregating the role of natural factors (the sun and volcano) to that from CO2 led linear anthropogenic contributions, than the discussion goes without any regard to proportion. The ocean matters most.
The State of the Union speech by the President of the United States on Tuesday the 9th February 2019 was modest with regard to climate change. It had been different from his assertion during the election campaign in 2016. A few months ago he distanced himself from thinking climate change is a “hoax” anymore, but he made clear that he still doubts whether humans are driving the phenomenon and thinks the whole thing could reverse itself. He used an interview (with CBS ) “to suggest scientists with “a very big political agenda” have fanned concerns about the phenomenon”. Is this about faith against science? The topic receives more and more attention. Meanwhile it is discussed as “Religious Identity, Beliefs, and Views about Climate Change” (Sonya Sachdeva, Sept./2018), or more recently David DeSteno in The New York Times (Feb.01), considering “What science can learn from religion”.
For sure, believe in matters concerning climate change is a dangerous venture. It’s one thing when the president “thinks”, but something completely different when climate science bridges knowledge gaps with “faith.” The trouble starts when sloppy language is used. On the other hand, if dimensions are hardly considered.
As regards the first complex, it should be remembered that the word climate is merely a general description, as the following quotes show and nothing has changed in this respect.
1953: Until recently, few meteorologists believed that we were living in a period of climate changes that could be substantiated by meteorological data. The changes deduced from such data were often dismissed as random, and it was thought that over longer period of records they would average out. John H. Conover, 1953, ”Climate Change as interpreted from meteorological data”, in: Harlow Shapley (ed), Climate Change Evidence, Causes, and Effects, Cambridge 1953, p. 221-233 (221) (Various II)
1963: In the past, the climatologist has been rather scorned by his colleagues in meteorology as a collector of tabulated data and a dabbler in statistics but this phase is happily passing into history and all the best meteorologists are now becoming climatologists. R.C. Sutcliffe, 1963, Theories of Recent changes of Climate”; in: Changes of Climate, Rome Symposium –UNESCO & WMO; UNESCO 1963, p. 277-280 (277, 279) (Various I)
1969: Only thirty years ago, climatology was generally regarded as the mere dry-as-dust bookkeeping end of meteorology. H.H. Lamb, Meteorological Office Bracknell, Berkshire (UK), “The New Look of Climatology”, NATURE, Vol. 223, September 20, 1969,
1979: This is obviously the decade in which climate is coming into its own. You hardly heard the word professionally in the 1940’s. It was a layman’s word. Climatologists were the halt and the lame. And as for the climatologists in public service, in the British service you actually had to be medically disabled in order to get into the climatological division! Climatology was a menial occupation that came on the pecking scale somewhat below the advertising profession. It was clearly not the age of climate. Kenneth Hare, 1979; „The Vaulting of Intellectual Barriers: The Madison Thrust in Climatology“, Bulletin American Meteorological Society , Vol. 60, 1979, p. 1171 – 1124 (Various IV)
2007: __At the middle of the 20th century, the study of climate was a scientific backwater. People who called themselves “climatologists” were mostly drudges who compiled statistics about weather conditions in regions of interest—the average temperatures, extremes of rainfall, and so forth. __Climatology could hardly be scientific when meteorology itself was more art than science. __(Aside)….. meteorology was scarcely seen as a field of science at all, let alone a science firmly based on physics. Meteorology, one academic practitioner complained to another in 1950, “is still suffering from the trade-school blues.” Spencer Weart, 2007, “The Discovery of Global Warming”: Chapter: Climatology as a Profession; http://www.aip.org/history/climate . Available as book: HARVARD UNIV.PRESS , 2003. (Various III)
On the other hand, the climate change subject may quickly drift into pseudoscience, alarmism, and propaganda, if relevant dimensions are widely ignored; respectively if extensive ignorance is bridged by faith. If a science declares this to be proven facts then things can hardly get any worse. The field of ignorance is easy to name, namely the oceans.
There are first of all the water volume. There is always water in the atmosphere. One estimate of the volume of water in the atmosphere at any time is about 3,100 cubic miles (mi3) or 12,900 cubic kilometers (km3). That is only about 0.001 percent of the total Earth’s water volume of about 332,500,000 mi3 (1,385,000,000 km3. If all of the water in the atmosphere rained down at once, it would only cover the globe to a depth of 2.5 centimeters, about 1 inch. MORE
This one inch water in the air, is the main part of the so-called greenhouse gas, distributed as water-vapor throughout the atmosphere to a height of 6,000 to 10,000 meters, where nearly all weather conditions take place. The two other main greenhouse gases, carbon dioxide and methane, contribute mere 4-5%, while water-vapor accounts for 95%. Even more relevant is the correlation between the water volume of the oceans, and what the atmosphere keeps in the air. About every 10-14 days the entire water in the atmosphere is replaced. Ocean condition decides largely on the transition from water to water vapor. Every day, meteorologists can watch the battles between low pressure cyclones generated by ocean evaporation, and anti-cyclones, a high-pressure area with low moisture. The weather
The sea is by far the biggest generator of vapor
making dominance does not end here, but needs to include the mean ocean temperature of just plus 4° Celsius. A fair assessment can only come to the conclusion that the global warming issue, as far as only based on calculating the role of carbon dioxide and methane, is mere speculation. Insisting on such speculation is reckless, pseudoscience, alarmism, and propaganda.
The outcome of the climate change discussion is a mess. Where climate science fails to explain what they do not understand yet, they abuse critics and require allegiance. Until now, they got the upper hand. Politics follows suit. Right and wrong disappears in the haze. What Trump is saying is worthless. Critic on his Union speech neither improves the matter, as the immediate reply by Senator Bernie Sander shows, who said:
“How can a president of the United States give a State of the Union speech and not mention – not one word – about climate change when the leading scientists of the world tell us that climate change is real, that climate change is caused by human activity, that climate change is already causing devastating harm in the United States”.
It will remain useless discussing climate change matters as long as science fails to show that not the oceans are the main driver of changing the weather on short and long terms, and evidently human activities at sea can be excluded as a contributor for sure.
Temperatures plunged to minus 26°Celsius in Chicago and minus 35°C degrees in Madison, Wis., last night (01/30/19). A polar vortex is triggering the coldest Arctic outbreak in the last two decades. That is the coldest spell since a generation. The Temperature contrast throughout the Northern Hemisphere is obvious, as indicated in the Figure to the right. There is today (01/30/19) atypical chill over large swaths of the US Northeast and Midwest. The Siberian cold is restricted to Siberia, but central Europe is significantly warmer as common at the end of January. Through December and January, low-pressure cyclones faced little resistance from high pressure fields from the Far East. Even now at the end of January, one cyclone is over the northern Baltic Sea, four more battle eastwards, ensuring that Siberian air do not reach the North Atlantic at Europe’s western shores. But while the Atlantic cyclones push eastwards, the Siberian cold moves eastwards either, presumably contribute to the chill over large region of the United States.
Very similar conditions occurred in February 2015, and a question was then, whether a mild winter in Europe contributed, and whether the warmer air conditions in Europe where at least partly related to human activities at sea, particularly by shipping, fishing, offshore wind farms, oil-drilling and so on. Fact is that the seawater temperature rise stronger in Europe’s regional and coastal seas as elsewhere. That could means, that Atlantic cyclones are more resistant on their way eastwards, and can either ‘supersede’ cold high-pressure, or push such air further eastwards. Which occurs in winter 2015 and the NOAA called it the “Siberian Express” (see Fig. below).
4.4 Warmer Europe’s distant implication by the ‘Siberian Express’?
Europe is not the world. However Western Europe is under the influence of the weather system from West to East. Atlantic low pressure areas move east, unless cold continental high pressure air blocks them. These are the winters that Europe talks about. This succeeds very well when the North Sea and Baltic do not assist the Atlantic weather because they cannot release enough heat or are hindered by sea icing. During last winter 2014/15 they served as perfect helpers and kept the cold from Siberia at a safe distance.
The more the Atlantic weather governs the situation beyond the Ural, the further Polar and Siberian cold will be pushed eastwards, called ‘Siberian Express’ . This was felt in Alaska, Canada and Eastern U.S.A. Many days were extremely cold with deviations from the mean of 20°C and beyond.
Perhaps North Sea and Baltic have contributed to the extreme cold in the U.S.A., at least a bit (Fig. 11), which should not be ignored but the mechanism must be understood.
Discussion
Regional seas in Northern Europe are minor from size and volume in global ocean affairs. Weather is “done” elsewhere, but every location contributes to the global picture. In the case of N-Europe it may be more significant as weather can be divided in maritime and continental influence, and due to the global air circulation from West to East, it is a gate. It may support the flow of warm wet air eastward (low pressure), or stem it by dry and cold continental air (high pressure), by diverting low pressure areas– in extreme circumstances – towards the Bering Sea or Mediterranean. In so far the North Sea and Baltic play a crucial role in how to open or close this gate.
But according to SST statistics, the gate sea area warming increase more than in other sea areas in Europe, and here stronger than the oceans worldwide (Fig.1). This phenomenon is not explained with a general reference to ‘global warming’. A reasonable explanation is pending. Many “weather factors” may play a role, such as river runoff, precipitation, cloudiness, sea ice cover, but that has not yet lead to a sufficient conclusion, as none of them can be regarded as a driver in climatic matters….. Cont.//
Basically only three facts are established: higher warming, a small shift in the seasons, and a decreasing sea ice cover. In each scenario the two sea’s conditions play a decisive role. These conditions are impaired by wind farms, shipping, fishing, off shore drilling, under sea floor gas-pipe line construction and maintenance, naval exercise, diving, yachting, and so on, about little to nothing has been investigated and is understood. The little that can be done is to do fundamental considerations:
If SST rise in the North Sea more than elsewhere (section 2) and human activities rise as well, the influence on the temperature profile Fig. 4-8 is a serious issue. During summer more heat is pushed down, but available for release during the winter season. The down push is a merrily mechanical exercise, while the interaction between the sea surface and the atmosphere is a highly complex matter requiring certain conditions. Thus it is easier to force heat mechanically into the sea body, while it takes some time until ‘natural processes’ release the ‘additional’ heat according the laws of physics. …. Cont//
SST can easily change from zero to several plus degrees. Very critical is the impact of vessels navigating in ice-fields, when the water body is cut-off from interaction with the atmosphere. As warmer water is less heavy, as colder water any vessel’s wake spreads below the ice bottom. Although sea ice mechanism and duration is intensively observed and studied in the Baltic Sea since the nineteenth century [8] the impact by human activities in the marine environment received hardly any attention…. Cont//
The warming of the ocean remains a wide open question
Posting: January 25, 2019
Is there some movement now in the discussion about ocean warming? A research paper published, in Nature Geoscience (January 21, 2019],* the following assessment: There is no definite connection between the solar cycle and the North Atlantic Oscillation (NAO)**, debunking the solar-cycle – North Atlantic winter weather connection. The paper focuses on 11 years cycles. While it is common knowledge that the NAO usually fluctuates over a period of a few years and has a huge effect on European weather, exactly what causes these long-term patterns, however, it remains unclear. Is it an external force, or an internal ocean affair, as mentioned in the last post about ocean warming?
* Insignificant influence of the 11-year solar cycle on the North Atlantic Oscillation
** The North Atlantic Oscillation is a weather phenomenon in the North Atlantic Ocean of fluctuations in the difference of atmospheric pressure at sea level between the Icelandic Low and the Azores High. Wikipedia
As the sun provides essentially all the energy that drives the Earth’s climate system, it is obvious that solar variations have the potential to directly alter climate. So far, so good. But what about climate change due to solar cycles? The problem starts when it comes to the question whether any of the climate changes during the last century results mainly from anthropogenic release of carbon dioxide(CO2) in the atmosphere, or can be partly be attributed to solar cycles. The former is by far the majority of scientists, represented by the Intergovernmental Panel on Climate Change (IPCC), while there are not only few saying that there is “proven by thousands of temperature datasets, the earth’s climate fluctuated cyclically in the past, and there’s an overwhelming body of evidence showing a close correlation with solar activity and other powerful natural factors.”
The correlation with solar cycles is now challenged the article in Nature Geoscience. The research essentially debunks what was considered a “demonstrated link” between the 11-year sun cycle and winter weather over the northern hemisphere and found it is actually, for the most part, a coincidental alignment. With the use of sophisticated computer modeling and extended observations, the new research shows that before 1960 evidence of any correlation simply vanishes. The theory was basically a mirage.
This leads to the immediate conclusion, that sun cycles have only a minor role in climate change matter. But instead considering the role of the oceans, the paper claims that: these apparent comings and goings of correlation are really due to atmospheric variability, and not the sun. How can the authors seriously assume that the atmosphere provides conditions, which can sustain a “difference of atmospheric pressure at sea level between the Icelandic Low and the Azores High” over a longer period, meaning weeks, months or even years? That is in no way thought out. Longer weather or air pressure deviations from average have either been caused by the sun or one part or several ocean areas. The authors Gabriel Chiodo, et al. miss a crucial point in their work, namely the role of the North Atlantic’s below its surface down to the bottom. Their research is nevertheless a big step forward, as it challenges the widespread theory of the influence of the sun variations even on short cycles of 11 years. Such papers will bring climate research closer to the ocean, very little, one small step never the less.
A paper by Gilbert P. Compo and Prashant D. Sardeshmukh, entitled: “Oceanic influence on recent continental warming”, raises the oceanic issue in a different way than this investigation, but the fact matters. For the interested reader two brief excerpts:
Abstract : Evidence is presented that the recent worldwide land warming has occurred largely in response to a worldwide warming of the oceans rather than as a direct response to increasing greenhouse gases (GHGs) over land. Atmospheric model simulations of the last half-century with prescribed observed ocean temperature changes, but without prescribed GHG changes, account for most of the land warming. The oceanic influence has occurred through hydrodynamic-radiative teleconnections, primarily by moistening and warming the air over land and increasing the downward longwave radiation at the surface. The oceans may themselves have warmed from a combination of natural and anthropogenic influences.
Concluding sentence:
The indirect and substantial role of the oceans in causing the recent continental warming emphasizes the need to generate reliable projections of ocean temperature changes over the next century, in order to generate more reliable projections of not just the global mean temperature and precipitation changes (Barsugli et al. 2006), but also regional climate changes.
Thrown suddenly in the climatic boondocks – Whilemeteorology is looking away
Posting: January 19, 2019
What makes climate changing – Military activities in wars?
The previous post was about „What is a winter in Europe?” Towards the end of January 1940, also the United Kingdom was severely affected. It came suddenly, unexpected, and without any precedence since industrialization. Anthropogenic abilities to interfere in the natural commons reached its first heights with the start of the Second World War (WWII). Suddenly, the weather in Europe runs amok. Eight decades later science has failed to explain to the general public what was all about, and whether a link to the huge military activities can be excluded for sure. How can anyone claim to understand
climatic changes, if incapable to understand and explain one of the most pronounced and sudden winter weather shifts in some regions during the last 150 to 200 years, which occurred without an ‘obvious’ reason (e.g. earthquake, volcano). Therefore the European weather drama in January 1940 should serve as a reminder that climatologists behaves irresponsible as long as they ignore this drama. Towards the end of January 1940, also the United Kingdom faced the worst possible weather conditions possible, here is a brief account
Ice storms are rare in the UK, but the worst incident was in January 1940, during the Second World War. It was the coldest winter for a century when, on January 27, a savage ice storm swept much of southern Britain. The landscape seemed to be encased in glass, trees looked like frozen waterfalls, and the ice weighed them down until they broke and smashed to the ground. (pay-wall:The Times, 2007)
Great ice storm paralyzed everything it touched – 27-30 January 1940
January 1940 was a severe wintry month with frequent frosts and heavy snowfalls. The CET for the month was -1.4C, the first sub zero CET month of the 20th Century and the coldest month since February 1895.
On the night of the 23rd, a minimum of -23.3C was recorded at Rhaydaer (Powys) a record low for that date. Other lows include -20C at Canterbury, Welshpool, Hereford and Newport in Shropshire.
The Thames was frozen for 8 miles between Teddington and Sunbury and ice covered stretches of the Mersey, Humber and Severn.
The sea frozed at Bognor Regis and Folkestone and Southampton harbors were iced over. The Grand Union Canal was completely frozen over between Birmingham and London. Central London was below freezing for a week and there was skating on the Serpentine on 6″ ice.
However, January 1940 will always be remembered for the Snowstorm and ice-storm that struck the UK. (Credit: http://www.theweatheroutlook.com)
SNOWSTORM
On the 26th, two occlusions were moving up from the SW engaged the cold air over the UK. At the same time, the anticyclone over Scandinavia was intensifying blocking the fronts from pushing through the UK, they became stationary over Wales and SW England. This resulted in a great snowstorm across many northern and eastern areas.
Vast areas of northern England reported between 30-60cm of level snow, the higher parts in excess of 60cm+. The snow drifted in the strong Sely wind even in the Centre of London. Other reports of snow depths include Eastbourne:- 25cm, Pontefract:- 37cm, Malvern:- 60cm and Exmoor: – drifts of 2.5m. The snowfall lasted till the 29th of January.
(Credit: http://www.theweatheroutlook.com
ICESTORM
On the low ground in the south, the precipitation fell as freezing rain. The raindrops were of the super cooled nature, so when the rain hit the surface, it would freeze instantly. This is a rare event in the UK and the 1940 is reckoned to be the severest that has struck the UK in recorded history.
The duration of the storm was remarkable lasting up to 48 hours in places. For instance at Cirencester, 48 hrs of freezing rain fell in temperatures of between -2 and -4C. The effect of this prolonged ice storm was severe and damaging. Many telegraph poles and wires were snapped, unable to cope with the weight of the ice. Flora and fauna suffered as well, many tree branches were snapped off by the enormous weight of ice, birds were unable to fly because ice accumulated on their wings. Travel was next to impossible as roads and pavements became skating rinks. Any sloped surface was impossible to climb. (Credit: http://www.theweatheroutlook.com)
A brief comparison between the early January 1940 and 2019
Posting: January 10, 2019
Our previous posting was about the question: “Is there another ‘Beast from the East’? The Met-Office considered it as possibility on January 03. More than a week later there is none, even though some places in Russia are currently cold but in no way exceptional. At some places the temperature will be about 7°C below average. Small regions in Central Europe (Bavaria and Austria) have been trapped in snow, but although the air temperature conditions across Europe are far off wintry.
In the following compare a report on weather in the current week (italic green) and early January 1940, which until now are ignored, although from 11-21 January five all-time records occurred- See Figure 1.
Deadly winter weather has blasted Europe for another day, trapping hundreds of people in Alpine regions, whipping up high winds that caused flight delays and cancellations and raising the risks of more deadly avalanches. Temperatures will fall widely across Europe over the next few days before rising again at the end of the week. Colder air will be in circulation on Wednesday and Thursday in a northerly to north-easterly airflow due to the position of high pressure in the vicinity of the British Isles and low pressure over the South East Europe, This colder air will move over warmer waters and bring further snow over central and South East Europe this week, the snow will be heavier and more persistent over the Alps as well as the mountains in Bulgaria.
What a difference to the weather conditions Europe experienced eight decades ago already in early in January 1940, as shown by an excerpt from [ http://www.seaclimate.com/c/c7/c7.html ]:
January 2, 1940; Esbjerg – soft or new ice, navigation not hindered, Danish light buoys were withdrawn over the next 10 days.
January 8, 1940: A record frost today covered Northern and Central Russia , with the thermometer at 31 degrees below zero Fahrenheit (-35°C), and impeded normal activity. (NYT, Jan. 09, 1940).
January 13, 1940: Riga/Latvia; The most bitter cold wave of years, which sent temperatures in Baltic countries to as low as 40 degrees below zero Fahrenheit, ended abruptly today. The mercury rose rapidly to a few degrees below zero Fahrenheit. Parts of the Baltic have frozen over, and floating and pack ice are likely to interfere with shipping for some time (NYT, Jan 14, 1940).
January 6, 1940; Drift ice in the East Scheldt . Ameland temporarily cut off from the mainland by ice. River Maas is frozen over from Woudrichem to Heusden.
January 14, 1940; Drift ice on river Scheldt reported to have torn buoys from their mooring. Simultaneously it was observed that “in these nine days conditions have deteriorated very rapidly and one sees the first real indication of somewhat abnormal conditions, most particular is the freezing of rivers Scheldt and Maas ” (Frankcom, 1940).
January 17, 1940; Ice reported in the North Sea off Jutland for the first time in many years, up to 2 miles from the coast. Fjord in Jutland frozen over. Ice three meters thick reported from western end of Limfjord. Minus 23°F reported during the night in Denmark
January 18, 1940; Helsinki : “Pitiless, deadly cold laid a glacial cover on Russian’s war machinery tonight… near Salla, above the Arctic Circle . Phenomenal 54-degrees-below-zero temperature (-48°C) restrained the Russian air forces… and apparently immobilized Russian ground forces, which have been attacking on the Karelian Isthmus (NYT, Jan 18 1940).
January 18, 1940: Temperatures of more than 50 degrees below zero Fahrenheit were reported from several points. At Nickby, northeast of Helsinki , a temperature of 58 degrees below zero was recorded – the coldest since 1878. It was 11 degrees below zero in Helsinki (NYT, Jan. 19, 1940).
January 20, 1940; “Thus they are able… to relieve men exhausted by a week of fighting in temperatures plunging to 60 degrees below zero” (NYT, January 21, 1940, p.23, left 1st column).
January 21, 1940: “The cold polar air remained stagnant over vast areas of Europe and North America . Result: Some of the coldest weather in half a century. In Moscow the temperature on January 17th dropped to 49 degrees below zero Fahrenheit (-45°C), and in parts of Finland to 58 degrees below zero. Such temperatures can be measured only on alcohol thermometers, because mercury freezes solid at 38 degrees below zero” (NYT, January 21, 1940, Weekend in Review, Title: War in the Cold).
The events described and the data clearly indicate that random processes are eliminated there. Why was Northern and Central Europe so badly affected? Southern Europe, including Switzerland , however, was much less affected from the Arctic temperatures simply because they didn’t have naval warfare at their front door, ……
“The highs (over North Europe), however supported a uniform inflow of cold air from northern Russia and Siberia, but blocked the way for mild air currents from the Atlantic and southern latitudes.”
This statement confirms the ‘weather blocking’ situation which was man-made by stirring the regional seas.
Since 2015 a number of postings have dealt with January 1940, here an example:
“Is there another ‘Beast from the East’ on the way?” is a recent post on 3 January, 2019 by Met Office Press Office. An excerpt is given below in italic and blue. At the moment there are little indication that this is more than a loose guess. Presumably Met Office could have been better, if they –and climatology as well – had started an in-depth investigation on what has happened after merely four months war activities. Suddenly Europe had been plunged in the coldest winter for more than 100 years. Already January 1940 was extreme Fig.1 [and HERE]. From many dozen news-paper report, we reproduce an excerpt from The New York Times, on January 21 January 27, 1940 and , with temperatures reported by NYT are in Fahrenheit, in italic and purple. The text is from the Book “Climate Change & Naval War”:
21 January 1940; “The cold polar air remained stagnant over vast areas of Europe and North America. Result: One of the coldest weather in half a century. In Mos-cow the temperature dropped on Wednesday (January 17) to 49 degrees below zero Fahrenheit (-45°C), in parts of Finland to 58 below zero. Such temperatures can be measured only on alcohol thermometers, as mercury freezes solid at 38 below. (NYT, 21 January 1940; Weekend in Review, ‘War in the Cold’).
21 January 1940: -23ºC was recorded at Rhayader (Wales).
22 January 1940; Severe snowstorms swept Europe from the Adriatic Sea to Scandinavia. (NYT, 23 January 1940).
It took almost a week before the NYT (NYT, 28 January 1940) could report what had happen in England, which goes at follows (Excerpt from Book)
Censorship commenced with the start of WWII. Weather was given a top-secret place. Only when Britain plunged into glacial conditions, not experienced for many decades, His Majesty’s Censor relaxed censorship on weather reporting and The New York Times was able to report as follows (excerpts):
“ London , 27 January 1940
British Cold Snap Can Now Be Told.
Military Censorship on the Weather Lifted – Freeze Severest Since 1894. 7-Degrees Low in London . Press Has Noted Subzero Spell in Europe Without a word of Arctic Conditions locally.
Now it can be told. For the first time since the war began, British censors today allowed that humdrum conversational topic, the weather, which has been a strict military secret in Britain, to be mentioned in news dispatches – providing the weather news is more than fifteen days old. The weather has been so unusually Arctic that by reaction the censors’ hearts were thawed enough to permit disclosure of the fact that this region shivered since past several weeks in the coldest spell since 1894, with the mercury dropping almost to zero and a damp knife-edged wind piercing the marrow. While British newspaper readers’ teeth chattered, the newspapers told them about a cold wave sweeping Europe, with sub-zero temperature records in Germany, Finland and neutral countries.”
Here are now experts from the Met-Office recent post concerning the ‘Beast from the East’ early in 2019. Full Text All images added.
There have been many headlines in recent days proclaiming a return of the ‘Beast from the East’ and ‘triple polar vortex to trigger heavy snow’ with bookies reportedly cutting the odds that this month will end as the coldest January on record following a sudden stratospheric warming high above the Arctic.
So, just how much truth lies behind these headlines and what can we really say about the weather for the coming month? Our Deputy Chief Meteorologist Jason Kelly explains.
Well, it is true that a sudden stratospheric warming has happened. The warming started around 22 December 2018 and the winds at around 30 km above the North Pole have now reversed from westerly to easterly. At ground level we know that sudden stratospheric warming tend to weaken the UK’s prevailing mild westerly winds, increasing the chances of us seeing colder weather a couple of weeks after a sudden stratospheric warming.
However, it’s important to note that not all sudden stratospheric warming lead to colder-than-normal conditions …cont.//
Certainly, for the first ten days of January there is no strong signal for a cold easterly flow that was associated with the ‘Beast from the East’ last winter, and it’s too early to provide detailed forecasts for what the weather will be like for the remainder of January.
Our current 6-30 day forecast points to the likelihood of more mobile conditions before the arrival of anything that might potentially be colder. Towards the end of January, however, there is an increased likelihood of a change to much colder weather generally, bringing an enhanced risk of frost, fog and snow.
This cold spell is by no means certain though, and ……… All HERE
Please be prepared for further information and analysis on winter weather development then and now and whether it is acceptable for one of the leading meteorological services not to be interested and able to explain the weather events after four months of World War II.
1939 Erzincan earthquake struck on 27 December local time – magnitude of 7.8
Post: December 26, 2018
It seems time to ask science why the ignored a meteorological highly interesting weather conditions surrounding the 1939 Erzincan earthquake in December 1939. Due to Second World War Europe was in turmoil since 1st September 1939. Several highly extreme weather conditions had already occurred. During the closing days further ‘surprising’ weather conditions showed up the Barents Sea down to the Mediterranean, extreme low temperatures, extreme high air pressure, exceptional snow, culminating in a very destructive earthquake in Turkey on December 27th, 1939. It followed a rare tsunami in the Black Sea, with further weather implications, as summarized in a CHRONICAL (below). By the end of December 1939 to general weather condition in Europe including the entire Erzincan earthquake offer a huge set of information on “how weather works” under extraordinary conditions, that one can only wonder why science has shown no interest in understanding and explaining the situation almost eight decades ago.
It follows an excerpt from Chapter “B. Cooling of Europe”, Section: “141 Turkey Earth Quake – 27 December 1939 (2_51)” from the Book:Climate Change & Naval War
“Once more a great disaster has visited a country, caused this time not by man’s inhumanity to man, but by a gigantic force of nature.” – “It is not likely that the new upheavals will teach the geologist anything new. They are evidence that nature has not yet finished with the earth.” – “What we urgently need is some method of predicting quakes and warning a threatened population.” (Extracts from the NYT Commentary on 29 December 1939).
Weather conditions before the earthquake
First indications that Central Europe had been ‘conquered’ by an anti-cyclone weather system, preventing milder maritime air from flowing through the middle of the continent, were available in the first half of December 1939 itself. Most significant deviation from the average weather became visible just a week before the earthquake struck. Between 21st and 22nd, temperatures dropped to below minus 30°C in Finland north of the Arctic Circle.
Around the same time (20th December), Northern Turkey had two high pressures of 1,040 mb attracting cold air from Siberia via the Caspian Sea. A low pressure (1,010 mb) shortly took control over Southern Turkey on 22nd, the high pressure returned again with two centres on 24th (ca. 1,040 mb), the pressure centre above 1,040 over the location of the epicentre on 25th, increasing to above 1,045 mb on 26th (02 hours), which increased over Eastern Anatolia to ca 1,050 mb during the early morning and presumably remained high until the earth trembled violently. Cont.
What happened after the earthquake?
All information on the Anatolia quake for readers interested in news was published by the NYT. The New York Times did a marvellous reporting job under the prevailing difficult conditions. While the NYT even became almost philosophical in its comments on December 29, about geology, the meteorological impact of the quake is highly interesting for practical purposes as well. Did the quake and its meteorological side effects contribute to the emergence of the extremely cold war winter of 1939/40 in North Europe?
At the Turkish Black Sea coast, about 150 km away from the epicentre, the quake generated a strong tsunami wave of up to a metre height that crossed the eastern part of the Sea in less than one hour. Cont.
Chronicle
6 December 1939; Severe earthquake, probably in Central America. (NYT, 6 December 1939).
22 December 1939; Early morning hours; a low pressure (965mb) over the Gulf of Bothina/ North Finland, and a high pressure over Western Rumania (1,035mb) control the weather in Northern and Central Europe[6].
22 December 1939; A very severe snowstorm brought shipping in the Black Sea and lower Danube river to a standstill on Thursday (21 December). At the coast the temperatures dropped to 15°C below zero. The storm in Bucharest caused considerable damage. (Hamburger Anzeiger, 23/24 December 1939). Snow also fell all over Bulgaria on December 21-22, starting a new cold weather episode (down to -16°C); on December 24th in Northern Bulgaria -20°C; December 25th until the earth quake in Turkey on 27th more moderate temperature below zero, showing no specific weather anomalies, (according to the Bulgarian newspaper ‘Zora’; by personal communication).
24-27 December; Baltic countries temperatures: In the Eastern parts of the Baltic countries (Russian West border) the temperatures fell to minus 17°C from 24th to 25th, and below 20°C one day later, extending to the Baltic coast, with minus 14°C in Klaipeda and minus 17°C in Gdynia (Bight) on 27th December 08-00 O’clock[7].
28 December 1939; 6,000 die in Turkey as quakes are felt around the world. Successive aftershocks take heavy toll of life and property in Anatolia regions. Los Angeles Area shaken. Central America is affected – London seismograph broken due to severity of tremors. (NYT, 28 December 1939). “Three additional tremors, subzero weather (minus 17°C) and blizzard winds, ..” – “Temperatures 22 degrees below zero (minus 30°C) and strong winds from the Black Sea claimed many victims…” (NYT, 29 December 1939).
28 December 1939; Tremors registered in California (116 miles south of Berkeley) South Africa, Italy. (NYT 29 December 1939).
28 December 1939; In New York record cold of 11.9° F; Four inches of snow reported in parts of State; Storms throughout the East. (NYT, 28 December 1939). (See above: NYT Dec.28,1939)
28 December 1939; Pope to visit the Italian King Victor Emmanuel today, for the first time since 1870, (NYT, 28 December 1939), see next: “28 December 1939”.
28 December 1939; Rome. “A cold dreary rain did nothing to dim the brilliance of the ceremony that began shortly before 10 o’clock.” – “ ….to see the Pope at all in such a weather.” (NYT, 29 December 1939).
29 December 1939; “10,000 soldiers with shovels, had cut through mountainous drifts of snow” – “The continued cold – as low as 22 degrees below zero Fahrenheit – seemed to be the greatest threat.” (NYT, 30 December 1939).
29 December 1939; Temperatures in Turkey temporarily minus 30°C. Casualties in the Erzingan’s region about 42,000. (Neue Zürcher Zeitung, 29 December 1939).
29 December 1939; Ice closes Danube to German supplies; Rail traffic expected to be hampered by snow (NYT, 30 December 1939) “Cold winds have been blowing recently westwards from Russia, and the constantly low temperature in the river valley indicates a general freeze will set in soon.” (NYT, ditto).
29 December 1939; From Agram in Yugoslavia minus temperatures of 32°C are reported. (Neue Zürcher Zeitung, 31 December 1939).
30 December 1939; Turkey: New quakes add to toll in Turkey. Many more villages reported destroyed – Relief efforts hampered. Floods in West Anatolia. Erzingan’s casualties in quake at 42,000 – Allied and other Governments speed aid. (NYT, 31 December 1939).
30 December 1939; “In Naples region today an unprecedented severe snow storm…”. Rome’s heaviest snowfall in recorded history – six inches – made the Romans feel as New Yorkers did in the 1888 blizzard. There had been nothing closer to this since the snowfall for three days from December 16 to 18, 1846”. (NYT, 31 December 1939) .
30 December 1939; Cold wave over the Riviera. Genoa rapid fall of temperature, extensive snowstorm. Trieste reports heavy winter storms. Malians had –10°C. (Neue Zürcher Zeitung, 31 December 1939).
1 January 1940; “Turkish people suffered a third natural disaster today, following earthquake and floods, when terrific storms swept the Black Sea. Huge waves were dashing against Anatolian shores, and it was feared that many ships were floundered.” (NYT, 2 January 1940).
How Naval War plunge Europe into Ice-Age condition after
mere four months in January 1940.
Post 12 December 2018
Several thousands of climate experts from around the world arrived for a conference on climate change, hoping to find a way the implementation of the Paris Agreement on climate change (adopted in December 2015). In Katowice, Poland, the Parties are aiming to finalize a detailed set of rules and guidelines – the so-called Paris ‘work programme’ or ‘rule book’ from 2-14 December – which will enable the landmark accord to be put into practice all around the world. Particular is the monetary aspect, namely the promise to raise $100 billion a year, from both public and private sources, by 2020 to help developing countries address climate change. The sum is mind-boggling, and the complete ignorance to simple historical events – for example the arctic winter in Europe 1919/40 – is shocking and dangerous.
The Second World War (WWII) was only 100 days old when weather in Europe started to run amok. It is easy to compile several dozen ‘unexpected and unusual’ events indicating that the weather started to leave common standards since December 1939. What happened as early as at Christmas Eve in Finland will be presented at the end of the post, as the climatic drama first culminated in January 1940, but continued well until mid-February, which is thoroughly discussed in numerous book chapter, online HERE & HERE.
One of the climatic high-lights of the winter 1939/40 had been a number of all-time cold records at many location in the Baltic Sea region, for example in Hamburg, on 12. February 1940. Almost a month earlier Poland reached to all time low, which brings us back to the current gathering in Katowice. In 277km distance in NNE and about 50km west of Warsaw is the village Siedlce. Already on the 11th of January 1940 the thermometer dropped to the incredible level of minus 41°C, respectively minus 41,8°Fahrenheit. At that time the Baltic Sea was still not covered with sea ice, which only happened in early March 1940, and for the first time in the 20th Century. How that could happen so suddenly, after the year 1939 had been within the normal temperature range, actually there had been a lasting warming since 1918, and the late 1930s had been the highest ever recorded.
Under such circumstances it is highly ignorant and gross negligent to talk about climate change in Katowice, although human activities may have cause, or highly contributed to record cold temperatures in winter 1940. The ignorance is particularly annoying, as the mechanism which lead to the rampage of climate can be easily attributed to the warmonger Adolf Hitler, who started WWII and this inigiated that huge naval force crisscrossed the sea, and churned and turned the sea up-side-down by shelling, mining, torpedoing, and bombing. The immediate consequences are easily explained by a daily exercise:
Too warm water in the baby-tube in cooled down by churning the water with the hand around. The North and Baltic Sea are like the baby-tube, warned during the summer season. If forcefully churned in autumn and early winter, any stored heat diminishes quickly, opening the way for cold air in anti-cyclones (high-pressure) to move frm Siberia westwards up the shores of the North-Atlantic, denying low pressure cyclones to travel straight eastwards, directing them either to the Barents Sea or South to the Mediterranean Sea.
That happened evidently in winter 1939/40. And what is climatology doing? They ignore it, although it would turn the whole climate change debate in a complete different direction. Evidence would be on the table that man is able to a moderst winter scenario into a disaster within a few months. One mad-man as Adolf Hitler is enough to cause the coldest winter in Europe over more than a century. The Katowice climate summit is bringing together around 30 000 delegates from almost 200 countries, top state officials, representatives of business and NGOs among them, but without the competence and interest to answer a fairly simple question: What cause the sudden climatic change in winter 1939/40? Which atmospheric condition caused the all-time cold record in the village Siedlce on 11th January 1940 and several other locations? What caused the full ice-cover of the Baltic Sea after more than 40 years? What caused the extraordinary Christmas Story narrated by a reporter from the New York Times (extract), which goes at it follows:
December 24th 1939: Report by James Aldridge: “The cold numbs the brain in this Arctic hell, snow sweeps over the darkened wastes, the winds howl and the temperature is 30 degrees below zero (minus 34.4° C). Here the Russians and Finns are battling in blinding snowstorms for possession of ice-covered forests. …I reached the spot just after the battle ended. It was the most horrible sight I had ever seen. As if the men had been suddenly turned to wax, there were two or three thousand Russians and a few Finns, all frozen in fighting attitudes. Some were locked together, their bayonets within each other’s bodies; some were frozen in half-standing positions; some were crouching with their arms crooked, holding the hand grenades they were throwing; some were lying with their rifles shouldered, their legs apart….Their fear was registered on the frozen faces. Their bodies were like statues of men throwing all their muscles and strength into some work, but the faces recorded something between bewilderment and horror”.
(NYT, December 25, 1939). Full article as jpg _ATTACHED to the left
more from NYT Dec.25, 1939: HERE & HERE ; The drama in Finland at Christmas is discussed HERE
Merry Christmas
For 79 years a rich set of weather data is available. The war parties collected them abundantly. The proofed easily that the German Reichkanzeler could have trailed and convicted as the first climate-change criminal. But climate science is not interested. They consume billions and billions in research a possible CO2 menace, ignoring the realistic threat by human activities in the marine environment. Presumably the biggest disaster concerning anthropogenic climate change matters.
Happy New Year 2019
the 80th year after WWII commenced on 1st September 1939
The narrow view of climate science is like the dismissed thesis that the earth is flat.
Post 09 November 2018
The two titles to this post are taken from a recent essay “Most People Live in a Flat Earth and Struggle to Visualize Climate and a Three-Dimensional Atmosphere.” by Dr. Tim Ball at WUWT on 04 Nov 2018. The assessment by Tim Ball that for to many people the earth is still flat, is a good start to discuss deficiencies in climate change matters. Focusing merely on the atmosphere, is a much to narrow view: “they look at weather maps but are unable to visualize the 3-D atmosphere.” But is this view not also too much restrictive? Is not the ocean the media which makes climate? Here at www.oceansgorvernclimate.com we think the discussion should be considerable wider, as all what concerns about weather and climate is primarily a water question. This issue was already prominent, long ago, by Leonardo da Vinci (1452 -1519).
Leonardo da Vinci’s musings on the nature of the world and what makes it tick is shown in the exhibition “Water as Microscope of Nature: Leonardo da Vinci’s ‘Codex Leicester,’ ” at the Uffizi Gallery in Florence since 30th October last week. He was convinced that the science of waters would enable him to reveal the organization and functioning of nature. The exhibition offers many hindsight how he viewed: water. Famous is his saying: Water is the driving force of all nature. And that brings in the term climate.
To ‘visualize climate’ it is necessary to tell the people what climate is. In the mentioned essay (above) Tim Ball merely offers this explanation:
“The idea of a differing angle of the sun is critical to understanding climate and climate change. This is why the word climate derives from the Greek word for inclination. It is also why the Greeks were able to identify three climate zones, the Torrid, Temperate, and Frigid”
Actually he wanted to provide further explanation to a previous essay at WUWT on 14th October 2018: “Climate Research in the IPCC Wonderland: What Are We Really Measuring and Why Are We Wasting All That Money?”, where he discussed in detail a 2006-paper “Does a Global Temperature Exist”, assuming: “that weather forecasting has not improved despite all the satellite and computer models and that climate forecasting has deteriorated, despite the trillions of dollars spent on computer models, government weather agencies, useless research, and unnecessary energy and environment policies based on their failed work.”
As a reminder, the subject is about global air temperature, and whether they increase globally. Air temperatures are part of local and global weather, but they are not weather. Temperatures are numbers or indicate more warm or more cold. By IPCC definition (Glossary 2018):
Global warming is an increase in global mean surface temperature (GMST) averaged over a 30-year period, relative to 1850-1900 unless otherwise specified. For periods shorter than 30 years, global warming refers to the estimated average temperature over the 30 years centred on that shorter period, accounting for the impact of any temperature fluctuations or trend within those 30 years.
There should be no room to use the term climate, which means traditionally “average weather”, respectively numerical data, of several dozen different atmospheric conditions or observations. Talking about “Visualize Climate and a Three-Dimensional Atmosphere” is of no help, to improve the meaningless use of terms as: climate, climate change, climate system a.s.o..Leonardo da Vinci indicated the direction: that water matters. When saying that water is the driver of nature it stands simultaneously for the oceans make climate, because they are covering more than 70 percent of the Earth’s surface and containing about 97 percent of its surface water, and the ocean stores vast amounts of energy in the form of heat.
That the assessment of global warming has deficiencies is due to the fact, as indicated by Tim Ball, that the coverage numbers temperature data are meaningless because there are only weather stations for about 15% of the Earth’s surface. There are virtually no stations for 70% of the world that is oceans, [of the continents about 80% are mountains, forest, desert and, grassland], see Fig.3 above. But the relevance of the oceans on long -term weather conditions (climate) is extreme higher than the mere surface coverage of 70%. With an average depth of about 3,688 meters (12,100 ft), only mere three meters of the water column is in the atmosphere, resulting in a ratio of 1000:1. Presumably Leonardo da Vinci would suggest to us to struggle to visualize all global water in any possible dimension and impact from and on human kind. Ignoring it is as if claiming the earth is flat.
The 2018 Annual GWPF Lecture: “Global Warming for the Two Cultures” provides no clue
Post Friday 26th October 2018
It sounds though when a speaker announces: “This lecture attempts to force the scientists in the audience to come to grips with the actual nature of the climate system”. Indeed one should wonder when someone is talking about the “actual nature of the climate system”, without telling in the first place, how he would like to define the term, as those commonly used are of little help. But let’s start with the recent lecture.
Definitions: IPCC, AR5, 2013, Glossary, p. 1450As always, Richard Lindzen was blunt, when telling the 2018 Annual GWPF Lecture: “Global Warming for the Two Cultures”, that man-made climate change does not appear to be a serious problem.The Professor (emeritus) of Meteorology for Massachusetts Institute of Technology says that much of accepted ‘politically correct’ knowledge is nonsense.
The lecture (55 min) is HERE. The text in PDF: HERE.
Indeed many aspects concerning the global warming issue could turn out to be nonsense. He indicated by saying: “Of course, the climate system is driven by the sun, but even if the solar forcing were constant, the climate would still vary. In this respect, the climate system is no different from other natural systems.”
But here we have to start wondering how carelessly Prof. Lindzen is using the term “climate system”. In the beginning he talked about the actual nature of the climate system”, suddenly he assumes that “climate system is no different from other natural systems”. That sound great but is scientifically of no help. It is too superficial. How do “other natural systems” look like? Would they indicate any distinction to a “climate system”? Hardly! Article 1 of the 1992 ‘UN Framework Convention on Climate Change,’ ( UNFCCC) says that:
“Climate system” means the totality of the atmosphere, hydrosphere, biosphere and geosphere and their interactions.
Would anyone object if someone would regard that as: “Natural system” means the totality of the atmosphere, hydrosphere, biosphere and geosphere and their interactions. According common definition: Nature is the phenomena of the physical world collectively, including plants, animals, the landscape, and other features and products of the earth. It seems difficult to detect a difference to a climate system. However, both refer to the world of physics.
The problem with climate science is that they fail to understand that the term “climate” is a mere statistical tool, in short “Climate is average weather”, as still enshrined in a longer version:
Climate in a narrow sense is usually defined as the average weather, or more rigorously, as the statistical description in terms of the mean and variability of relevant quantities over a period of time ranging from months to thousands or millions of years. The classical period for averaging these variables is 30 years, as defined by the World Meteorological Organization. The relevant quantities are most often surface variables such as temperature, precipitation and wind. Climate in a wider sense is the state, including a statistical description, of the climate system.(Source: IPCC, AR5, 2013, Glossary, p. 1450)
The sea is by far the biggest generator of vaporThat physical- interaction play a role is nowhere mentioned. The reference to “average weather” is still only statistic, and “surface variables such as temperature, precipitation and wind” is not weather, but mere, although important parts – of many dozen weather criteria. Assessing by “statistical description in terms of the mean and variability of relevant quantities over a period of time ranging from months to thousands or millions of years”, has little chance to produce a useful and serious discussion.
Only by such negligence Prof. Lindzen could assume that his “description of the climate system contains nothing that is in the least controversial, and he expects that anyone with a scientific background will readily follow the description.” Here is one of his examples that show what is wrong with such much too general approach:
1st statement: The system we are loking at consists in two turbulent fluids (the atmosphere and oceans) interacting with each other…
2nd statement: It is important to note that such a system will fluctuate with time scales ranging from seconds to millennia, even in the absence of an explicit forcing other than a steady sun. Much of the popular literature (on both sides of the climate debate) assumes that all changes must be driven by some external factor. Of course, the climate system is driven by the sun, but even if the solar forcing were constant, the climate would still vary.
First Remark: When mentioning that “The atmosphere and oceans interacting with each other…”it would be helpful to express clearly, that it happens due to water, which comes from the ocean, which governs the earth by a ratio of 1000:1.
Second Remark: The mentioned time scale up to millennia is only due to one turbulent fluid, namely the ocean, while the atmosphere without the ocean input would last for hardly more than a few weeks.
Third Remark: More than 70% of all sun radiation is received by the ocean, which has a higher storage capacity than the continents that makes the oceans to the driver of the global weather system (See last box below).
A slowing down of the global ocean’s MOC is the likely cause ofmost of the global warming that has been observed since the latter part of the 19th century.15 I hypothesize that shorter multi-decadal changes in the MOC16 are responsible for the more recent global warming periods between 1910–1940 and 1975–1998 and the global warming hiatus periods between 1945–1975 and 2000–2013.
Solar variations, sunspots, volcanic eruptions and cosmic ray changes are energy-wise too small to play a significant role in the large energy changes that occur during important multi-decadal and multi-century temperature changes. It is the Earth’s internal fluctuations that are the most important cause of climate and temperature change. These internal fluctuations are driven primarily by deep multi-decadal and multi-century ocean circulation changes, of which naturally varying upper-ocean salinity content is hypothesized to be the primary driving mechanism.
Climate models are junk, if not primarily based on data from the ocean
Post: 03 September 2018
The greatest scientist of the last century, H.H. Lamb (1913-1997), felt that modeling was too uncritically. One reason was presumably that he started to make the first connections between sea-surface temperatures and the atmospheric circulation (The Independent, 1997). He was also the one who observed in 1969 that “Only thirty years ago climatology was generally regarded as the mere dry-as-dust bookkeeping end of meteorology (NATURE). It seems little has changed during the last 50 years. Actually it got much worst. Science used to define climate as ‘average weather over a period of 30 years versus the period from 1901 to 1930, but consider the term climate now “as the statistical description in terms of the mean and variability of relevant quantities over a period of time ranging from months to thousands or millions of years.” (DETAILS HERE) This is poor science and makes climate science a joke. Even the most incomplete definition would require that the impact of the ocean be greatly emphasized (see the Fig. 1 & 2).
The tragic of the climate change debate is that climatology is not willing or able to the accept a basic notion by Voltaire (1694 – 1778)
“If you wish to converse with me, define your terms.”
Recently Tim Ball used this quote out of his observation that “Explaining Global Warming to the Public is Impossible Because We Are Not Talking the Same Language” (WUWT, 23 Sept.2018) Although he touches the problem frequently (e.g. WUWT, 28 May 2018) he misses the crucial point to understand climate change and what human kind is contributing – the role of the oceans.
It is not too difficult to imagine why H.H. Lamb felt that climate modeling was too uncritically, as he was serious on the connections between sea-surface temperatures and the atmospheric circulation. By the time Lamb would have realized that ‘global climate’ [regardless of a definition] depends on the status of the sea –from top to bottom – to 95%+! But climatology works to 95%+ with data from the atmosphere, respectively ‘weather data’. Why is Tim Ball wondering that climate skeptics and mainstream climatology are not talking the same language, although both fail grossly when it comes to the ocean? The main division comes from believing in or being skeptical of climate models. Those produce scrap if not fed with ocean data, which at best exist only randomly. Sceptics fail to make this their main argument.
Even the former director of the Royal Dutch Meteorological Institute, Henry Tennekes, takes a too narrow view (from: A Climate of Stage Angst) :
Climate models are quasi-deterministic and have to simulate daily circulation patterns for tens of years on end before average values can be found. The much more challenging problem of producing a theory of climate forecast skill is left by the wayside.
The horrible predictability problems of turbulent flows then will descend on climate science with a vengeance.
Indeed it will not work if the focus is not the ocean. For climate models one need primarily ocean data. Tennekes himself was hardly aware what that actually means, when he wrote the essay: “Karl Popper and the accountability of numerical Weather forecasting” (in: Weather, Vol. 47, p.342-6, 1992):
“Popper’s interest in predictability…in meteorological terms, a perfect model of the atmosphere, initialized with perfect data from an observation network of infinitive resolution, and run on an infinitely powerful computer, should in principle produce a perfect forecast with an unlimited range of validity”.
Popper understands the problem of modeling perfectly. But if he restricts the problem to the atmosphere he is lost to forecast weather and climate over more than a few weeks. H. Tenneken hardly looks a little bit further, when he assesses:
“…..[those] that advocate the idea that the response of the real climate to radiative forcing is
adequately represented in climate models have an obligation to prove that they have not overlooked a single nonlinear, possiblychaotic feedback mechanism that Nature itself employs.”
Nature does not overlook anything. Nature is driven by water and energy, both of which is up to one-thousand times more relevant as those in
the atmosphere, at least if talking about a longer period of time. It is high time to ensure that any climate definition or climate models put the oceans first.
Talking about climate change would become easier and raise the chance to understand, when and why man has change climate during the last 100 years – for example – by global cooling from 1940 to the mid-1970s, as indicated in the above Figure ‘ocean-temperature’ (see www.seaclimate.com) .
What happened when World War II commenced on 1st September 1939. A global cooling
started from winter 19391940 lasting to the mid-1970s. Why? If the reason was the war at sea it would prove that man can change climate in a short period of time of few months or years!
The Ocean status is ready for the next big cooling, which is the real threat for mankind.
Post: 16th August 2018
In a previous post we discussed Younger Dryas cooling about 13,000 years ago. Another dramatic cooling occurred at ca. 8,200 y B.P. in the Early Holocene that was triggered by the glacial drainage of freshwater into the North Atlantic and is recorded in multiple climatic archives across the globe. Frequently this side discussed substantial man-made weather and climatic changes during the two World Wars 1914-1918 and 1939-1945 (for 1939/40 see Fig. 3), MORE; and is convinced – based on strong facts – that shipping and other ocean uses by man has significantly contributed to global warming during the last 150 years (Fig. 5, 6), more HERE.
Now 16 eminent scientists published a study in the Proceedings of the National Academy of Science – PNAS August 6, 2018 – titled: “Trajectories of the Earth System in the Anthropocene” mentioning the ocean and seas -except as CO2 sink – not with one word. Instead they talk big about our planet at risk of heading towards an irreversible “Hothouse Earth” state. The abstract opens with the statement
We explore the risk that self-reinforcing feedbacks could push the Earth System toward a planetary threshold that, if crossed, could prevent stabilization of the climate at intermediate temperature rises and cause continued warming on a “Hothouse Earth” pathway even as human emissions are reduced. Crossing the threshold would lead to a much higher global average temperature than any interglacial in the past 1.2 million years and to sea levels significantly higher than at any time in the Holocene.
Eventually the authors consider ten natural feedback processes they regard are as “tipping elements” that lead to abrupt change if a critical threshold is crossed, naming permafrost thaw, loss of methane hydrates from the ocean floor, weakening land and ocean carbon sinks, increasing bacterial respiration in the oceans, Amazon rainforest dieback, boreal forest dieback, reduction of northern hemisphere snow cover, loss of Arctic summer sea ice, and reduction of Antarctic sea ice and polar ice sheets. The authors shows that they lack any clue on how the global climate system works, and that the oceans are – next to the sun – the decisive driver of the weather system and climatic change events. That is shocking and undermines any hope that climatology will understand human impact on the Earth system, and whether man risks contributing to a HOTHOUSE or COLDHOUSE, any time soon.
Not less shocking is the observation that the study by the team of 16 international scientists (Will Steffen, et al.) was merely dismissed partly for “that there was no new science here”, but not therefore that the highly evident impact of the ocean is entirely ignored (see above). Even such highly attentive critics as Prof. Judith Curry, seems far away of addressing the serious deficiencies of the study, merely remarking in her post at (excerpts from “JC reflections”)
If the paper wasn’t so heavy on the policy prescriptions, it would be a much more credible contribution. //cont.
For almost a decade, I have been arguing that we need to articulate the possible worst case scenario for climate change. Such an articulation would take climate science beyond the restrictions of climate models to understand how the climate system works in terms of interacting feedbacks and also abrupt climate change. We need to bring more discipline (and creativity) to this interesting and important endeavor.
That is by far too little. At least Prof. Judith Curry is right that more efforts are needed “to understand how the climate system works”. But this requires immediate recognition of the major role of the huge and extreme cold water masse contained in the oceans and sea concerning weather and climatic matter, and profound and thorough research about the historic events (e.g. naval war changed climate), present (shipping, fishing and other ocean uses) and future human ocean activities that may influence climate change.
Judith Curry raises the part to the sociology of
climate science only. The oceans are what matters most.
Post July 25th, 2018
Talking about the difference between ocean circulation and climate more generally is per se a strong massage that there is a strong correlation. Back in 1984 Carl Wunsch discussed the matter already lengthy in: ”The Global Climate”, ed. John T. Houghton, Cambridge p.189-203). He raises a number of topics, saying for example: “The role of the ocean in climate and climate change is unlikely to be demonstrated and understood until observations become meaningful in terms of physics being tested” (p.189); and “There is no substitute for adequate data”, (p.200).
More recently Carl Wunsch published the paper “Towards Understanding the Paleocean” (Quaternary Science Review, 2010, p. 1960-1967). Almost a decade late the paper surfaced due to Prof. Judith Curry while doing a literature survey for a paper on Climate Uncertainty and Risk. As she regarded the paper by the esteemed oceanographer for a fascinating perspective on paleo-oceanography and paleoclimatology, she used it for a post on her blog Climate Etc.; titled: ”The perils of ‘near-tabloid science’” on July 22, 2018. Unfortunately she chooses a one-sided approach by selecting only excerpts of relevance to the sociology of climate science. The oceanic part is completely neglected, although the Wunsch paper expresses the view understanding the dynamics and physics of the ocean is a perquisite for predicting future climate. Merely concentration on the sociology of climate science indicates to the fundamental problems in the climate change debate is distracting from the core issue of climate: the oceans. One need only to read the comments to Curry’s post at Climate Etc. & WUWT. The ocean issue is not discussed.
Carl Wunsch has raised the need for ocean observation throughout his career as oceanographer (see above). In his essay of 2010 he mention inter alias:
__ Myriad hypotheses have been put forward as rationalizing some elements of the oceanic role in
influencing climate–ranging over essentially all possible time scales out to the age of the ocean. One cannot begin to discuss all of these, and so I will here take as a not-untypical example, the hypothesis that the North Atlantic circulation largely controls the climate system, and in particular, the notion that the surface salinity is the determining influence.
___ As with future climate, where no data exist at all, the models promise descriptions of climate change –past and future– without the painful necessity of obtaining supporting observations.
___ The study of paleoclimate encompasses such a huge range of problems, methods, regions, phenomena, time and space scales, that no one has mastered it all. With that complexity, any science runs the risk of becoming so abstract, or so devoted to particular stories, or both, that they lose relevance to the physical world.
(1) The problems of climate are global: understanding of the nature of the mean ocean, and its variability cannot ultimately be isolated from even remote regions. Dependence on distant regions is only weakly a function of the space-time scale of any particular disturbance —in many cases, signals of change are transmitted globally extremely rapidly, but with final equilibrium requiring decades to thousands of years.
(2) Any true global observing system will be an amalgam of disparate elements such as altimeters, drifters, gliders, floats, and moorings.
(3) True understanding of the climate system can be claimed only if all the observations are considered (….).
(4) True understanding of the climate system requires a synthesis of the disparate data types with the dynamics believed to govern the system. (5) ….
(6) Quantitative use of data and models cannot be done without adequate knowledge of the likely errors of both. (7…; 8….)
(9) Any useful ocean observation system must be open ended in time—there is no low-frequency cut-off to the time scales over which the system is capable of change, and new physics always enters as the time scale increases. Much of what we see today may well be the result of changes and forces acting in the distant past. Design considerations must thus include the ability to sustain a high quality system indefinitely so that those long times are ultimately observed.
Carl Wunsch’s message is explicit. Without an in-depth, profound and long lasting ocean observing system the climate change debate remains an unsolved and shaky debate.
To explain Younger Dryas cooling look at what modern ocean uses is contributing to climate change
Post: July 13; 2018
About 13,000 years ago, the warming out of the last ice age temporarily reversed course around the North Atlantic. This cold “Younger Dryas” period lasted almost 2,000 years. Fig. 1. Like most climate events that primarily affect the North Atlantic region, ocean circulation is the prime suspect, starts a recent article by I.D. Keigwin et al. (Nature Geoscience). Indeed, any huge input of water in the ocean wills inevitable change the temperature, salinity and subsequently the horizontal and vertical current. A high volume influx of meltwater can jam regional or global ocean circulation. The consequence is a climatic change, for example the Younger Dryas cooling. That is what the paper is talking about (summarized HERE) .
Discussing big climate changes in a similar context is by far not new, with little avail. Too remote is overriding influence of the ocean on any change taken into account. Due to its cheer size low average temperature of mere +4°C, and variation in salinity, its relevance in the climatic system is 1’000 times bigger than of the atmosphere. A comparable very small water body of meltwater, cold and salt free, can easily trigger a very substantial drop of air temperature and an ice age. If the mentioned research concludes that melting water was “most probably the trigger” for the Younger Dryas cooling, it avoids discussing the ocean issue. Why? Is it a too big issue? Are too little data available? What could be done to overcome this problem?
A number of similar papers show the same short comings. In 2010 Andres E. Carlson discussed “What caused the Younger Dryas cold event?” , respectively Xu Zhang, 2014 “Has the puzzle of rapid climate change in the last ice age been solved?” Both mention remotely a slowing of Atlantic circulation, but remain far away from linking the periods of ice ages to the overriding structure of the oceans that can easily be triggered by numerous causes climatic changes, for example: meltwater, earthquakes, meteorites and so on. That is difficulty to assess after ten thousand, several hundred thousand or millions years, as ocean circulation is changing, leaving no direct record.
Does that prevent progress on understanding the impact of the ocean structure on climate change? It does not! Science need not more to do than investigate the impact of ocean activities at and in the sea. Shipping, fishing, off-shore industry, and other activities have an immediate profound effect on the temperature and salinity structure in the upper sea surface level. Those are not peanuts if one has to talk about many 100 Millions of nautical miles per day. Down to 10 meters the sea surface is mixed, leaving a wake that changed the temperature and salinity structure. Science does not even see that this is a serious contribution to global warming over the last century.
While general sea activities alter the ocean structure very slowly, mankind has shown that it is able to act also very forcefully over a short period of time. It did so during the two World Wars 1914-18 and 1939-45. In both cases the global climate changed course over few decades. Science needs only to pick up the challenge to explain the global warming after WWI and the global cooling from about 1940 to the mid-1970s. (more HERE) That research would enable science for better understanding historical drastic temperature jumps, but also understand urgently that
Industrial and leisure activities at sea is a serious contributor to Anthropogenic Global Warming (AGW),
How easily man can influence weather and climate, and
The most dramatic threat to men is global cooling from the vastness and depth of the oceans, which can come quickly and with ice age temperatures the current civilization can hardly cope with.
__Post 25. May 2010 – “Dr. Don Easterbrook, Professor of Geology at Western Washington University in Bellingham, WA.
_About 12,800 years ago we plunged into the Younger Dryas, said Easterbrook. When we came out of the Younger Dryas, temperatures again shot upward, rising 15 degrees in just 40 years.
_”Expect global cooling for the next 2-3 decades that will be far more damaging than global warming would have been,” says Easterbrook. “Twice as many people are killed by extreme cold than by extreme heat.”
A dangerous thesis: “Forget human influence. Cooling and warming are both natural” – Dr. Don Easterbrook
Oceans-Make-Climate
READ Letter | Published: : E. Maier et al,
North Pacific freshwater events linked to changes in glacial ocean circulation, Nature (2018). DOI: 10.1038/s41586-018-0276-y
The powerhouse in global weather and climate – The Ocean.
Post 17. June 2018
Global warming haunts the general public for three decades. The vast majority of weather and climate scientists claim that human generated carbon dioxide (CO2) is warming the world and causing climate change since the 1980s. Fixed to this issue they are presumably the ultimate threat to a water planet as this earth. Any possible anthropogenic impact on the oceans and subsequently the weather and climate should be a major issue, which requires that all possible mechanism must be understood thoroughly. The current scientific community is fixed on the atmosphere, including sun and volcanoes, but considers the sea too remotely. That is dangerous! The oceans-govern-climate!
It is extremely rare to hear a voice that emphasizes the connection between water and climate as a prerequisite for understanding climate changes. In a recent post concerning fundamental climatic changes over geological periods WIM RÖST (WUWT – 15.June) asserts that all changes were due to water, which determines the ‘General Background Temperature’ for the Earth, resulting in Hothouse and Ice House Climate States. Interesting is his assessment that “the temperature of the deep ocean is the main factor. Deep-ocean temperatures from -1 to +3 degrees Celsius, as we have now, keep the Earth in an Ice House State. Slightly warmer deep-oceans with temperatures from 6 to 10 degrees Celsius* bring the Earth to a Warm House or a Hot House Climate State.”
More to the point of understanding the link ocean-climate today is Joe Bastardi in a post of 14. June 2018 : “More Evidence Water Vapor Is The Big Climate Kahuna”, by accentuating that:
Well, what is the number one source of thermal energy on the planet, with 99.9%? The oceans. What is the prime source of water vapor (and arguably CO2)? The oceans.
Joe Bastardi, highly skeptical of the relevance of CO2 assumes that: We are chasing the wrong thing in our attempt to quantify and understand the climate;
In so far we are fully on his side, but too narrow when merely questioning whether: Is the increase of CO2 warming the ocean because of the radiative properties? Or are the state of the oceans a product of many things, the sun a primary driver?
The question should instead be based on the current ocean structure and physical mechanism. What impacts have the various human marine activities from shipping, and fishing to off-shore installations? Any activity may warm or cool the sea surface, which immediate or long term impact on the state of the atmosphere. After all the sea-surface temperatures (SST) are only warm in a very thin layer, while the ocean total average is only about +4° Celsius. Was the global cooling from 1940 to 1970 caused by WWII? Screw driven vessels are likely to have contributed to warming the SST over more than 100 years. Sub-surface activities, as off shore industry, fishing and naval wars , affect the vertical temperature and salinity structure over considerable water depths. Neither Wim Röst nor Joe Bastardi have any clue about anthropogenic ocean change, although Wim Röst gets the general view right:
Oceans create ‘climate states’ and in the atmosphere, ‘weather’ is created by water vapor. (From last section of the post).
Ever closer to reality – Global warming caused by the oceans
Post: May 20, 2018
It is that easy! Global mean temperatures are always forced by changes in heat release and heat uptake by the oceans. That is the core message of an essay by Professor Sybren Drijfhout from Southhampton University: The relation between natural variations in ocean heat uptake and global mean surface temperature anomalies in CMIP5 ; is published on 9th May 2018 in Nature Scientific Reports. It says: “New research has shown that natural variations in global mean temperature are always forced by changes in heat release and heat uptake by the oceans, in particular the heat release associated with evaporation“.
However, big reservations need to be made. It is OK that the essay is very technical. It is inacceptable that it is far away to explain the role of the global oceans in global warming and cooling matters. Instead it is merely talking about models, models and more models. But models can only be of help if the physical mechanism behind the weather and climate system is understood. For that it is necessary to mention that the oceanic heat content is 1000-times bigger that of the air and has only an average temperature of mere plus 4° Celsius.
Talking about the warming of the oceans, should not only be subject to computer simulation, but should consider possible causes. A major factor is definitely human activities at sea. Shipping, fishing, and off-shore facilities have a huge impact on the sea surface temperature (SST). All screw driven vessels and boats are likely to turn over the upper sea-level on a distance of 100 Million kilometers very day. This is a huge potential for warming the oceans. Since motor ships cross the seas, the global temperatures are on the rise, except for the two world-wars related periods. HERE & HERE.
As Professor Sybren Drijfhout research is confined to shown that in all cases variations in global mean temperature were correlated with variations in heat release by sensible and latent heat; it will be still a long way to understand the human contribution on ocean warming. It sound even naive when he says “these variations are associated with heat transfer due to temperature differences between the surface ocean and the overlying air, and heat transfer associated with evaporation. The heat fluxes are also called the turbulent heat fluxes.” More in a press-release.
At least the blog Watts-Up-With-That“ (WUWT) picked up the message regarding it as vindication for Dr. Roger Pielke Sr. who has said that global ocean heat content is the best metric for tracking global warming. (WUWT-05/15/18) Prof. Pielke Sr is one of the very few who is willing to give the ocean a more prominent role in climate change matters, but is hardly much closer to it as Prof Drijfhout. But that is another story. For the moment it is important if an essay considers: Ocean forcing the atmosphere, and global warming caused by the oceans.
A recent guest essay by Albert Parker at WUWT, (28. April 2018) states:
“There have been many recent claims that “climate change” was the reason for conflicts, with also the war in Syria explained by the anthropogenic carbon dioxide emission. However, this is not settled science, as this claim is wrong.”
He is right and he explains it to some extent – which the interested reader should read in full HERE -, but he is talking nonsense either, when ignoring the correlation between the two World Wars 100 and 70 years ago, as discussed many times here in previous posts.
The Parker-Essay miss to analyze of the presented temperature data for Berlin-Tempelhof and Berlin-Dahlem with the caption (in red):
Fig. 1 – Wrongly phased anthropogenic global warming for the start and the end of World War II. World War II did not start because of an early outbreak of anthropogenic global warming and did not end with more renewable energy and more carbon taxes mitigating this warming. Temperatures in Berlin were at a record low at the start of World War II September 1, 1939, and more than 3 degrees Celsius higher when Soviet soldiers raised their flag on top of the Reichstag building on May 2, 1945. Top temperature profiles from NASA GISS (GHCN V2 on left, GHCN V3 on the right) in Berlin – Temple. Middle images from Wikipedia of the start and end of the war. Bottom temperature profiles from NASA GISS (GHCN V2 on left, GHCN V3 on the right) in Berlin –Dahlem.
A more in-depth research would have shown that the sudden drop of the annual temperature in 1940 was actually a winter issues. Out of nowhere the winter 1939/40 was the coldest for more than 100 years, as well as the subsequent winter 1940/41 and 1941/42. In so far it is important to realize that the sudden extraordinary weather condition prevailed during the winter seasons. As the influence of the sun diminishes strongly from October to February, it is much easier to investigate the causes. When taking into account that main region of coldness stretched from Great Britain to St. Petersburg and Moscow, respectively covered the North – and Baltic Sea, it is inevitable to consider a decisive link to the huge naval activities in these semi-enclosed waters. They store heat during the summer season, which is released during winter. The more the water is churned by winter of human activities, the quicker the heat is released, diminishing the heating capacity. Cold air from the Arctic or Siberia can establish their reign over Europe up the North Atlantic. That easy was it to plunge the war winter 1939/40 to a record low.
The impact of naval war on the first three war winter in WWII is evident (see links to a detailed analysis: below). The three first WWII winter in Europe could serve as evidence how easy climate can be changed by human activities. Actually it happened in connection with the First World War, and moreover the three decades global cooling from 1940 to mid-1970is a serious naval war matter.
Hence the guest blogger Albert Parker, misses the problem he discus complete, but stands in line with main stream climatology neither able or willing that oceans-govern-climate, and that they fail to prove by analyzing the impact of naval war on weather and climate in the two World Wars.
The book: FAILURES OF METEOROLOGY! UNABLE TO PREVENT CLIMATE CHANGE AND WORLD WARS? OCEANS MAKE CLIMATE!
by Dr. Arnd Bernaerts
Links to nine Chapters on Naval War during the 1st war winter 1939/40 Book pages 13 to 104
A clear language matters. Meaningful definitions are essential in science. Climatic science seems a hopeless case in this respect. They brought themselves to prominence three decades ago, but for them “Climate in a narrow sense is usually defined as the average weather”. It follows a few abstracts from current definitions:
„weather“ (AMS) = ___The state of the atmosphere, mainly with respect to its effects upon life and human activities. ___Popularly, weather is thought of in terms of temperature, humidity, precipitation, cloudiness, visibility, and wind. ___The “present weather” table consists of 100 possible conditions, with 10 possibilities for “past weather”
climate (AMS) = _ The slowly varying aspects of the atmosphere–hydrosphere–land surface system. __…suitable averages of the climate system
climate (IPPC) = __relevant quantities over a period of time ranging from months to thousands or millions of years __relevant quantities are most often surface variables such as temperature, precipitation and wind
(more on climatology, climate system and climate sensibility, see below)
Meanwhile they talk big, about statistics from months to millions of years. But weather data may comprise hundreds if not much more types of data, which too often are merely roughly defined.
They not recognize that statistics from months to millions of years do not explain anything, but opens a wide spectrum for manipulation. In a recent post by PH.D. Roy W. Spencer [February 16th, 2018] about: “Diagnosing Climate Sensitivity Assuming Some Natural Warming”, the used terms should raise alarm. Can statistics be “sensitive”? At best only if the type of statistic and duration versus “what” is named! Particular worst it gets if climate science refers to “natural”. In essence the atmospheric weather (and its statistical mean) depends on the thermodynamic state. Heat and water are the main ingredients. It is all about physics. “Natural” whether natural warming or natural climate sensibility is hoax, meaning actually “I do not know”. Fairness to oneself and the general public requires to say so: I do not know. Fantasy terms reflects either ignorance, dumbness or cheating. Roy Spencer uses both in this post as it follows (bold added):
What if a Portion of Recent Warming Was Natural? As you might recall, the IPCC is quite certain that the dominant cause of warming since the mid-20th Century was due to anthropogenic forcing. What does “dominant” mean? Well, I’m sure it means over 50%. This implies that they are leaving the door open to the possibility that some of the recent warming has been natural, right? Well, we can use the above equation to do a first-cut estimate of what the diagnosed climate sensitivity would be if some fraction of the surface and deep-ocean warming was natural. (Full Spencer text HERE)
Throughout climate science many meaningless terms are used. This is particularly problematic because it prevents to look at what matters most in climate and climate change issues: the oceans. Look at all the references attached to this post, you will find nothing. Instead you can read at Roy Spencer the sentence:
I have heard some IPCC-type folks claim that recent anthropogenic warming could have been damped by some natural cooling mechanism.
Admitting, as long as the IPCC is superficial and is talking nonsense, any reply is difficult, also for a serious researcher as Roy Spencer. But not reflecting in any climate relevant term and definition the vastness and influence of the oceans and their low temperatures of mere + 4°Celsius, renders any discussion on man-made climate change into a general bland chatter. That is not only sad and a great pity, but dangerous, because climate cooling is the by far more serious threat to mankind.
„weather“ (AMS) = ___The state of the atmosphere, mainly with respect to its effects upon life and human activities.
___Popularly, weather is thought of in terms of temperature, humidity, precipitation, cloudiness, visibility, and wind.
___The “present weather” table consists of 100 possible conditions, with 10 possibilities for “past weather”
climate (AMS) = _ The slowly varying aspects of the atmosphere–hydrosphere–land surface system.
__…suitable averages of the climate system
climate (IPPC) =
__relevant quantities over a period of time ranging from months to thousands or millions of years
__relevant quantities are most often surface variables such as temperature, precipitation and wind
climatology (AMS) = ___Descriptive climatology deals with the observed geographic or temporal distribution of meteorological observations ___meteorological observations over a specified period of time
climate system (AMS) =
__ The system, consisting of the atmosphere, hydrosphere, lithosphere, and biosphere, determining the earth’s climate as the result of mutual interactions and responses to external influences (forcing). ___ Physical, chemical, and biological processes are involved in the interactions among the components of the climate system.
climate sensitivity (AMS) = ___The magnitude of a climatic response to a perturbing influence.
___In mathematical modeling of the climate, the difference between simulations when the magnitude of a given parameter is changed.
___In the context of global climate change, the equilibrium change in global mean surface temperature following a unit change in radiative forcing.
Anthropogenic global warming (AGW) has reached the court room. A lawsuits by State of California vs BP, Chevron and others, charge that oil products are a public nuisance (court documents). The Judge William Alsup ordered to held a Tutorial on 21st March 2018 , inter alias concerning: “formation and melting of the ice ages, periods of historical cooling and warming, smog, ozone, nuclear winter, volcanoes, and global warming” for being introduced to “the best science now available on global warming.”
The Order did not request a tutorial on the role of the ocean. Water is what matters most in climate matters. The ocean hold 1000times more water than the atmosphere, but have only a mean temperature of about 4° Celsius (Fig. 2 & 3). 6 After a five hours hearing recorded in the page 189 long court-transcript, the court was merely introduced to the findings of IPCC since 1990, respectively AGW advocates. Even the defendants did not object but made the case: “that oil companies are not directly responsible for climate change. Rather humanity’s larger economic decisions are to blame.”
Is it worth to read the transcript? Actually: No! At best it is a summary of what IPCC and other AGW opponents are talking about. Ever since, for them is the ocean only a random issue. For example they tell the Court:
Excerpt from court-transcript: page 123f (concerning the last Century EARLY WARMING; see Fig. 5)
BOUTROUS: So that’s that figure. And let me go into a little bit more recent period, 1850 to 2012. And, again, 1850 was the end of the little ice age. And this is really the point the Court was just making. The IPCC AR5 concludes that: “Since 1901 almost the whole world has experienced surface warming. Warming has not been linear; most warming occurred in two periods: Around 1900 to around 1940 and around 1970 onwards.” And so, again,…. (cont/)…… ………..And since I knew you would ask me what caused that warming I thought I would just go with that quote because I think what they are basically saying is that in the early 20th century, while it’s unlikely that the climate was functioning – the warming was caused by the climate functioning in its natural course, internal variability, the IPCC couldn’t quantify any contributions to the warming from potential other causes, like changes in the sun or volcanos. That’s the natural forcing. THE COURT: What does “internal variability” mean? MR. BOUTROUS: That is their phrase for just describing the natural, natural variability in the climate without some event like a volcanic eruption, which is what they call a natural forcing sort of an event. (cont/)
That is an extreme superficial view, because the warming 1920-1940 was primarily an Arctic and Northern Hemisphere issue (see Fig. 4) and commenced together with the First World War (Fig. 5).
Another example of pure gossip one can find on page 183f:
THE COURT: Give us an example. Give us an example of a theoretical or plausible surprise out of the blue.
MR. WUEBBLES: Besides the permafrost melting?
THE COURT: Yes. Yes, that’s a good example, but give us another one.
MR. WUEBBLES: So another one would be the melting of Artic sea ice…..(cont/)
….page 184…
THE COURT: What kind?
MR. WUEBBLES: Biospheric production.
THE COURT: Oh, biosphere. Okay.
WUEBBLES: Yes. So the changes in El Niño events. You know, if we were to have a lot more El Niño events that would add to the overall warming. There’s a lot of other aspects that are surprises, things we don’t really expect but they are things we just don’t know about.
The ocean covers 71% of the globe; El Niño covers an ocean space that is a small fraction of 1%. Any ocean space has at any time a huge impact on the atmosphere and drives average air temperatures. The fact that an El Niño is a significant event, tells nothing about how the ocean contributes to warming and cooling. Telling the Judge that “more El Niño events that would add to the overall warming”, is hardily helpful.
One should not expect that the court ruling will improve the climatic change controversy in any way. After all merely requested information and explained it at the hearing as it follows (From the transcript: Page 6 & 7):
THE COURT:
Okay. So let me just say to you two, as well as to the public, that I read in the paper a couple of weeks ago that this was going to be like the Scopes Monkey Trial. And I was — I couldn’t help but laugh. But this is not a trial. I want everyone out there, the newspaper people, please
don’t call this a trial. This is not a trial. In these technology cases, mainly the patent cases, but not just patent, we often have these tutorials so that the poor Judge can learn some science, and it helps to understand the science….. (cont/)….This is a serious proposition to try to educate the Judge. So that’s the purpose.
The Cold’s arrive again. Only three weeks ago our post “The ‘Beast from the East’ – Off-Shore windfarms pave the way” discussed the sudden cold snap in Europe, because it is highly possible that human activities at sea, contribute to unexpected low temperatures influx from the Far-East. The explanation is simple: As soon as the reginal seas across Europe have lost too much of their heat stored during the summer season, cold air from Siberian can reach Europe and establish reign for days or weeks, respectively delay the arrival of spring.
The last few days weather development support the thesis. Europe’s spring, respectively the months April, May and June are likely to show sub-temperature, as indicated in Fig. 1. Already forthcoming April the forecast indicates a significant negative anomaly (Fig. 2), with the North Sea and Baltics in focus. Why does it happen exactly in the regions? The explanation presumably stems from the various anthropogenic activities at sea. Lengthy discussed HERE:
Temperature drops of 10 degrees Celsius can be expected as the cold air arrives Friday into the weekend. “Sunday will be the coldest day with maximum temperatures struggling to lift above freezing across the U.K., Belgium, the Netherlands, Germany, northern France and southern Scandinavia.” Wind chill values may dip as low as minus 10 degrees Celsius – equivalent to the mid-teens Fahrenheit.
With cold air blowing over the North Sea and an upper-level pocket of cold air, areas of snow showers and squalls are once again a likelihood to the U.K, Ireland, northern France and southern Scandinavia this weekend.
Difference from the cold snap three weeks ago.
The cold air will work its way south and west into most of the rest of Europe later in the weekend (17/18 March). It is in this part of Europe where the cold will persist the longest well into the week of March 19-23. This pattern will also generate areas of snow that will persist through much of that week in southern, central and eastern Europe. Some of that snow will be moderate to heavy, not simply in the Alps, but also from parts of Germany and Poland to the Ukraine.
The phrase “Beast from the East” refers to the fact this cold air arrives on strong winds blowing east-to-west from Scandinavia over the North Sea into the British Isles and western Europe.
In a world which is getting steadily warmer it sound a good question to ask for the main source for the incremental rise in temperatures on earth. The excellent blog of Judith Curry did it (2018/03/09), while Willis Eschenbach picked up the subject at WUWT. It is worth to read both post,
Prof. Curry’s starting point is a reference to the IPCC AR5 (Report 2013) which concluded that:
“It is extremely likely that more than half of the observed increase in global average surface temperature from 1951 to 2010 was caused by [humans]. The best estimate of the human induced contribution is similar to the observed warming over this period.”
It is little Prof. Curry offers herself to contribute on her question where the heat is coming from. Neither does Willies Eschenbach who stress that nobody knows much about the up-and-down since the Romans, but that “ … none of those gradual temperature changes were caused by variations in CO2”. Subsequently he mentions that the sun is the source of all heat, but stress univocal:
“Now, does this show that the sun is indeed the cause of the gradual warming? ABSOLUTELY NOT. There are plenty of forces at play in even this restricted subset of climate variables, and the fact that a couple of them line up does NOT mean that one is causing the other.”
What Willis Eschenbach wants to say is simply: I do not know. Nobody knows. That sounds fair but is nevertheless unacceptable. Anyone who is aware that the earth is a water planet and water is as much essential for the weather (and climate) as the heat from the sun; and is aware of the size of the ocean with a ration to the atmosphere of 1000:1; and is aware that the mean ocean temperature is as low as about 4°C, would not exclude the ocean from any research and accounting of global heat and of global cooling.
A thorough assessment of shipping since using screw driven vessels, and other human activities at sea, would inevitable show that this contributed to global warming since the end of the LIA considerably. The tonnage has increase in 90 years by 2600% (Fig.5). A much more profound demonstration of man-made climate changes by maritime activities offer the two World Wars; the First (1914-18) by a influencing the Ocean around Svalbard, causing a warming from 1918 to 1940 , and during the Second WW (1939 -1945) revolving so much cold water to the sea surface that the world cooled for three decades. (see Fig. 1, 3 & 6) For details see: http://www.seaclimate.com/ and http://www.2030climate.com/
Again, Curry and Eschenbach are both excellent writers, serious and committed, but seem unable to raise the item which matters most in weather (and climate): the oceans. As Willis Eschenbach has extensive seagoing experience and regards himself as “…. a long-time ocean devotee.” , he could do more concerning the ocean-climate issue.
Recently we discussed here: “Europe winter free – Thanks to off-shore windfarms?”; showing that when reginal seas are cooled to ‘unusual levels’, Siberian icy cold air can easily travel to the Atlantic shore. Something similar just occurs right now outside.
Don’t believe that this spring is bound to being cold by natural cuase. If you do not see at least an attempt to consider a serious human contribution reject it as too superficial and incomplete. As shown in Fig. 1 & 2, the center of cold are the North-Sea and the Baltic Sea. For Europe they functioning like a storage-heater. During summer they take heat in, during winter they release heat. The latter is particular important to keep the west-drift working. This means, moisture warm air moves from the Atlantic east-wards toward the Ural Mountains, until it is stopped by continental cold and dry air. The weaker the maritime air is, the easier she not only gets ‘pulverized’ by the cold and dry air, but opens the path for the ‘Beast from the East’ to travel to the Atlantic shore.
Until now science has never cared. Many posts and research remained unnoticed, for example a recent essay: HERE-2016. Highly active is the news press, but offer nothing in explanation. Here some excerpts:
__Meteorologist Alex Burkill told the Evening Standard that the cold snap was likely to mirror freezing winter weather seen in March 2013 – the second coldest March recorded in more than 100 years.
Today conditions
__ Dominik Jung warns against such complacency and dismissive attitudes: The icy cold, also called the Russian Whip, is really going to hit starting on Sunday. Foremost nights are going to be especially cold. Low temperatures are expected to fall under double-digits below zero. Over snow covered ground minus 20 or minus 25°C are possible. Even lower temperatures are possible directly at ground level.”
__Jesper Starn and Rachel Morison at Bloomberg: Cold air flows from Siberia will send temperatures 10 degrees Celsius (18 Fahrenheit) below normal next week, when Germany, France and parts of Britain are expected to get the coldest temperatures this winter, weather forecasters said….. The freezing conditions will last through the first 10 days of March for Britain, the Netherlands, Germany and Scandinavia and could bring heavy snowfall, Dobson said.
There is no mentioning of any anthropogenic aspects, whether big or small, although the matter leaves hardly any room for neglecting a significant human contribution. For further information see the following links
Are jurists able to deliberate climate cases? That was a question asked by Ron Clutz in a recent post (22.Dec.2017): “How many other jurists have prepared themselves for this battleground?”, referring to a discussion by Jason Scott Johnson, et al; Global Warming Advocacy Science: A Cross Examination(2010, PDF, 80 p). A very recent defamation case the court showed strength by calling the article “a poorly written opinion piece that offers views on conventional climate science”. The case was dismissed. The clear verdict was released on February 13, 2018, (Judgement ca. 23p) based on the following circumstances. .
The Supreme Court in British Columbia/Canada had to handle a dispute between a climate warm-monger, Andrew Weaver (plaintiff), and on the other hand a climate skeptic Timothy (Tim) Ball (defendant). Both are Professors and well versed in the climate research field since long. Now the plaintiff required damage for defamation by a Tim Ball article on January 10, 2011, entitled: „Corruption of Climate Science Has Created 30 Lost Years”. (full text: Judgment – Schedule A – p. 20-22).
Whether the Judge, Mr Justice Skolrood, has any in-depth knowledge about the climate change debate is hardly to say. Presumably not. His reasoning shows the professional capability of careful reading and analysis. Without calling in experts for cross-examination (Judgement p. 6/7), he made, inter alia, the general observations:
[60]“… despite Dr. Ball’s history as an academic and a scientist, the Article is rife with errors and inaccuracies, which suggests a lack of attention to detail on Dr. Ball’s part, if not an indifference to the truth.”
[63]”…that people read a 45-year-old text on climate science written by Professor Hubert Lamb”.
[64] “Overall, even as an opinion piece, the Article presents as poorly written and it provides little in the way of credible support for Dr. Ball’s thesis”.
Reading through the huge blog-share on climate change matters, what percentage of posts, whether pro or contra, would be characterized similar? The number would surely be high, but to what effect? Improve the climate change debate?
I am extremely grateful for the judgment of a complete dismissal in the lawsuit brought against me by Andrew Weaver. It is a victory for free speech and a blow against the use of the law to silence people. As with all events, there is so much more that rarely receives attention yet is essential to understanding and improving conditions in the future.
This statement ignores the principle damage done to science in general and him in particular. The claim was rejected because of his ‘meaningless’ chatter, presumably not worse than those of Andrew Weaver. Tim Ball is certainly a serious man, but the Judge had not to look at that, but only to identify a case of defamation, which he not rejected entirely, saying:
[83] “….While the Article is derogatory of Dr. Weaver, it is not defamatory, in that the impugned words do not genuinely threaten Dr. Weaver’s reputation in the minds of reasonable thoughtful and informed readers”
What a blow, at least in this case. Let us end the discussion at this point, with the reminder that this blog challenged Tim Ball twice concerning the meaning of the term climate; HERE in July/2015, HERE October/2015, and HERE January/2018. When his 2011-text emphasise “that he has taught science for the last 30 years”, which means since 1981, he should have realized that all sections of scince is talking about climate but not able to ensure that the use of the word ‘climate’ is based on reasonable scientific definitions. Lamb and Hare (see Figures) stressed that Cliamte used to be a layman’s term.
Whether jurists are able to say something about global warming, may be only secondary to experienced judicial deliberation, which the Supreme Court in British Columbia could demonstrate in the case Weaver vs Ball fairly well .
F. Kenneth Hare (1919-2002) on: DEFINITIONS OF CLIMATE
Canada’s most distinguished geographer and climatologists,
the late Professor F. Kenneth Hare, explained that climate
was a layman’s word, and that the professional use is still erratic
Extract from section: Climatic Variability and Change (ca. 1984)*
“The word climate is often seen as ambiguous, because of confusion with related words like weather, or vague climatic conditions. In fact it is capable of fairly exact definition. In recent years, moreover, public usage seems to have moved closer to that of the professional.
In lay usage, climate usually stands for the expectation of weather on time-scales comparable with a human lifetime; it is the layman’s sense of the sequence of weather he or she may expect at a given locality. As such it governs countless daily decisions, from choice of personal clothing to the work calendar of the farmer. Habitually this expectation is taken for granted. Only when unexpected weather occurs does the ordinary citizen become acutely aware of the stresses that the atmosphere’s behaviour can bringsometimes to the point where the question is asked (as it is below): `is the climate changing?’ This question arises from the suspicion that recent weather lies outside normal expectation, that is, outside the present climate.
Professional usage is still erratic, but usually starts with the same idea of expectation. It is assumed
that a climate exists at any given moment; and
that the integrated experience of the recent past specifies this climate.
We tend to assume that the near future will resemble this recent past. For lack of any better guide we accept a dictum attributed to Whitehead: how the past perishes is how the future becomes. We think it highly probable that past experience will repeat itself. In effect, we assume that the climate of today will endure for an undefined period.”
Climate Science ignorance helps to keep heavy cold at bay
Post: 3rd February 2018, by Dr. Arnd Bernaerts
It seems time to praise science, but only if you do not care and prefer warming. In Europe winter are getting warmer at a pace faster than global average. The current winterproves it again. Whereas North America and Siberia saw record braking freezing temperatures in early 2018 (more), Europe is spared of wintery weather until now (Fig. 1). The most likely reason is increasing ocean use, particularly by off-shore windfarms and shipping, which churn the sea like moving spoon in a hot coffee pot. While climatology is not able to consider this mechanism, any cold from the Arctic or Siberia is kept at bay. That should have been common knowledge since long, at least since the commencing days of World War II.
Actually the story is simple. Since the Little Ice Age has ended around 1850, the world has been getting warmer. By the end of the 1930s the temperatures, particularly in the Norther Hemisphere, increased to level close to current values. That stopped abruptly during the first war winter 1939/40 (Fig. 2, 3). The cause is to attribute to excessive ocean penetration due to naval warfare on a grand scale, bombs, sea mines, depth charges, many million shells, and thousands of vessels, navigating, fighting, mine-operation, surveillance, and training. However, the impact on the winter conditions than and today seems contradicting. Winter 1939/40 was in many locations the coldest for up to 200 years or ever recorded, while currently climatology will soon declare Europe’s winter 2017/18 the warmest ever. The tragic is that both cases have the same source, man-made climatic changes, but science does not know, and is unable to inform politics and the general public correctly.
The way man has contributed to the extreme climate conditions in winter 1939/40 and 2017/18 is based on the same physically-dynamic process. The starting point is the intake of heat during the summer season in the reginal seas around Europe, particularly in the North- and Baltic Sea, which will be released during the subsequent winter. This ‘natural’ process is meanwhile greatly enhanced by human activities. The more or the longer the atmosphere gets an extra heat input, the less any Arctic or Siberian cold will get a chance to govern the winter in Europe. But the stored heat is not unlimited. If the available heat is released too quickly, the result reverses. When reginal seas are cooled to ‘unusual levels’, Siberian icy cold air can easily travel to the Atlantic shore. That occurred in winter 1939/40. As an example then and now, see Fig. 4 & 5.
The winter meanwhile 78 years ago, could easily explain how reginal climate works. One needs only to imagine the picture of a baby bath with too warm water to bath the baby. The water will be turned around until the temperature is right for the baby. The longer it is turned the colder it gets. Is it so difficult to acknowledge and apply the every day experience with a too hot soup? The warring naval forces did the same across the coastal seas in Europe. It took only four months, and the first WWII winter run amok. Those responsible for this event, in first place the German Reichskanzler Adolph Hitler, should have been identified as a person appropriate to be considered as ‘climate change criminal’ since long.
OK! Mr. A. Hitler may never have been charged due to insufficient scientific advice and being a crackbrained monster. But ignoring the case entirely raises the question of gross negligence. WWII contributed to a global cooling from 1940 to the mid-1970s. Ocean uses in all its facets, is likely to have contributed to the global warming over the last 150 years. The vast installation of hundreds of off-shore windfarms during the last decade is certainly a contributing factor to the higher than the global warming of the seas around Europe. In the North and Baltic Seas temperatures increased five to six times faster than the global average over the past 25 years, and three times faster in the Black and Mediterranean Seas. (Related Essay in PDF) Science spend many billions to prove a correlation between CO2 and global warming, but not one cent on how shipping, fishing industry and naval activities have influenced weather and climate conditions since the end of the Little Ice Age around 1850. Climate science behaves highly irresponsible.
Links to nine Chapters on Naval War during the
1st war winter 1939/40. Book pages 13 to 104
Judith Curry’s reflection: “Well, increasing temperatures say nothing about the causes of climate change.”
Post 15th January 2018
The terminology climate science use is all but helpful. Is it accidentally or consciously misleading? There is no scientifically sustainable definition of weather, climate, and natural variability (MORE). Only when it comes to “warming”, we know that it is connected to a rise in air temperature, but with numerous variations at not less locations.
Someone who didn’t bother about precision and details, is James Hansen, who already in 1988 in testimony before U.S. Congress, warning that increasing atmospheric CO2 concentrations would lead to spiraling global warming said: that it was 99 percent certain that the warming trend was not a natural variation but was caused by a buildup of carbon dioxide and other artificial gases in the atmosphere. (Fig. 1), and that there was no ”magic number” that showed when the greenhouse effect was actually starting to cause changes in climate and weather.
Almost every explanation beyond the fact of the general warming trend since the mid-19th Century was superficial and largely meaningless, including the 99% claim of CO2 certainty. Only two years later his colleagues C.K. Folland et al concluded the IPCC (1990) Chapter 7, Summary on “Observed Climate Variations and Change (Fig. 2) with the notion: „Because we do not understand the reasons for these past warming events it is not yet possible to attribute a specific proportion of the recent, smaller, warming to an increase of greenhouse gases.” (Fig. 3)
The contrast to James Hansen could hardly be greater, but IPCC overcome this problem quickly, readily with the next IPCC Report in 1995. The ‘trick’ is explained by a recent post at “Climate Etc.” (Jan/03/2018) titled “Manufacturing consensus: the early history of the IPCC”. Prof. Judith Curry reviews a book by Bernie Lewis that shows the scientific debate on detection and attribution was effectively quelled by the IPCC Second Assessment Report (1995). Indeed Chapter 8 does not hesitate to establish an initial evidence “of an anthropogenic climate signal – if models are correct” (Fig.5). The entire Chapter 8 Conclusion see Fig 5 & 7.
Fig.5
Fig.7
As a few excerpts from news report in 1989 show the pressue to establish a ‘greenhouse scenario” run high. (Fig. 8, 9, 10)
Actually the modeling is about increased air temperature, as indicated in the final paragraphs of Chapter 8. And here the notion of J. Curry comes in: ”increasing temperatures say nothing about the causes of climate change.” That is great but too little. One can only identify the “causes of climate change” if a meaningful explanation of the term is established. That has never been the case (See below: EXCERPT from www.whatisclimate.com). Otherwise the discussion fouls the general public. ‘Warming’ and ‘climate’ should not arbitrarily mix up. It needs to be clear that temperature rise is a rise in temperature and nothing else. A pitty that even a excellent professional as Judith Curry seem not able to grasp the point.
A decade ago Prof. Roger Pielke Sr. started his invaluable blog with a post titled “What is Climate? Why Doesit Matter How We Define Climate?” (July 11, 2005). Repeatedly he picked up the issue during the active running time of the blog until November 2012. He was the best in this respect, but eventually did not manage to offer sustainable concept of weather relevant definitions. In “Physics Today” (Nov.2008, p.54f) he wrote: “For many, the term “climate” refers to long-term weather statistics. However, more broadly and more accurately, the definition of climate is a system consisting of the atmosphere, hydrosphere, lithosphere, and biosphere”. That is as meaningless as the official definition in the UNFCCC (Climate Convention, Article 1 (para 3), 1992):
“Climate system” means the totality of the atmosphere, hydrosphere, biosphere and geosphere and their interactions.
The term “climate” remains meaningless, but weather and nature would fit better.
A more recent example is in a post be Tim Ball & Tom Harris at WUWT (Dec.01; 2017), which stress that: Some simple definitions are important for the public to understand, while offering in detail only scrap of no substance, namely:
Weather is the total of the atmospheric conditions at any given moment. It includes thousands of inputs from cosmic radiation from deep space, heating energy from the bottom of the oceans and everything in between.
Climate is the average weather conditions, and how they change, at a given location, over an extended period of time. While one can describe “daily climate,” obtained by averaging the 24-hourly readings or averaging the minimum and maximum readings in a 24-hour period, much longer periods are normally studied by climatologists.
No serious science community benefit from such nonsense. At least one and a while efforts are made to categories ‘Climate’ differently, as recently at Science Matters (11Jan2018), when assuming that “that global warming/climate change theory properly belongs in the field of social studies and thus should demonstrate a similar cycle.” – continue reading. That would also make the use of the term CLIMATE in the global warming debate obsolete.
The starting point is that “climate” is generally defined as average weather (by WMO and others) without defining “weather” in the first place (discussed HERE and HERE). It is a comparison between apples and pears. One item has a physical background; the other item is a ‘man-made’ technical mean, which we know as “statistic”. “Weather” consists of many dozen components (AMS-Glossary), which can be described in many hundred ways (see HERE). The statistics of single physical element, or specification of atmospheric behavior, remain an abstract mean.
Completely irresponsible not to understand how the naval war caused an ice age winter 1939/40
Post 02 December 2017
The recent climate talks in Bonn (COP23) worked on the pledge to limit global warming below two degrees Celsius. The target is extreme naïve, as long as climate science is not able and willing to analyze and explain what happened to the weather in Europe in the first few months since World War Two (WWII) started September 1st 1939.
Europe suddenly experienced its coldest winter in more than 100 years. The change came suddenly and completely unexpected. Shortly later the British scientist A. J. Drummond expressed his amazement as it follows: “The present century has been marked by such a widespread tendency towards mild winters that the ‘old-fashioned winters’, of which one had heard so much, seemed to have gone forever. The sudden arrival at the end of 1939 of what was to be the beginning of a series of cold winters was therefore all the more surprising”. 70 years have passed and science is completely ignorant on an evidently human interference in weather and climatic conditions due to naval warfare. Talking about warming without understanding cooling by man is suicidal ignorance, and terribly irresponsible.
The suddenness is what counts most. From one day to the other man befell the sea with unknown, widespread brutal force. Only four months into WWII, Northern Europe was back in a small ice age. Numerous meteorological extreme conditions reveal a strong relationship to the high level of naval warfare activities. For example:
__The regions most affected in Europe were those close to North Sea and Baltic. (Fig. 1, 3, 4, 5, 9, 11, 13)
__Highest sea ice extent in the North Sea (German Bight) in several decades.
__The first entire freezing of the Baltic Sea in the 20th Century.
__Record cold in Poland – Siedlce, -41,0°C, 11 January 1940 (Fig.13)
__Moscow lowest ever recorded −42.1 °C (−43.8 °F) in January 1940 (see Wikipedia).
What had happened? Thousands of ships crisscrossed the North Sea and Baltic day and night, ordered to fight, to monitor, to train. Cruising and fighting warships conducted a gigantic “field study”. Huge masses of water were agitated, and consequences were quickly felt. The warmth stored during the summer season, especially in the North Sea and Baltic was released more rapidly than unusually. Siberian icy air could reach Western Europe’s shores.
Although the extreme winter of 1939/40 offers a unique opportunity to understand how easy and quickly man can modify and change weather conditions and climate, the matter is completely neglected. Although the WWII parties collected data abundantly, climate research by several hundred universities and institutions, comprising several ten-thousand scientists has never undertaken efforts to analyze the “field study”, and to explain why the weather ran amok. Instead they scare the general public and governments with “global warming”, supporting the annual collection of $100 billion a year to help developing countries to reduce their greenhouse gas emissions and blame the effects on climate change. Towards those figures understanding the war winter weather 1939/40 would cost almost nothing.
Not able or willing either to confirm or exclude definitely a link between naval war and weather modification indicates is a miserable failure. If the situation would not be so serious, one would tend to speak of a hoax.
Is Red Sea warming exceeding the global rate a matter of climate change?
Posted: 06 November 2017
The warmest semi-enclosed sea in the Northern Hemisphere is more warming than the global average. The Red Sea basin experienced a rapid warming, at an overall rate of 0.17 ± 0.07 °C per decade, exceeding the global warming rate of 0.11°C per decade. The research team from the King Abdullah University of Science and Technology (KAUST) HERE, mention as major concern that ocean warming with climate change is creating challenges for organisms. WUWT etc. picked up the story.
Of more interest is the notion “that the impacts of warming are likely to be greatest in semi-enclosed seas, which tend to support warming rates faster than average”, if the researcher would have at least tried to say: Why? Unfortunately they do not, although it is worth a bet that intensive shipping is a serious contributor to the excessive Red Sea warming. Several hundred sizable vessels navigate the Rad Sea at any time. Down to 15 meters each sizable vessel stirs the water up-side-down. The ships wake is evident. In the light of our last post concerning the increased North Sea warming: “Off shore wind farm impact is not natural variability”, some consideration is inevitable.
To begin with, the North Sea and Red Sea have only one thing in common, both are regarded as semi-enclosed waters. In all other major features, depth, temperatures, seasonality and salinity, the differences are huge. The Red Sea is about 2250 km long and, at its widest point, 355 km wide, with maximum depth of 3,040 m and an average depth of 490 m. While the ocean means temperature account for a mere 4°C, the Rd Sea offers a very different picture. The average surface water temperature during the summer is about 26 °C in the north and 30 °C in the south, with about 2 °C variation during the winter months. The water body temperatures increase to about 27° at the bottom (Fig. 2 & 5). The overall average is 22 °C. As the rainfall is extremely low, averaging six centimeter per year, the Red Sea is one of the saltiest bodies of water in the world, owing to high evaporation, with an average salinity of 40 ‰. Highly remarkable is the uniformity of the water body over all seasons, very different to the North Sea.
Actually there are not many options to explain the much higher warming of the Red Sea versus global ocean warming. The basic condition has certainly to do that we lock at a confined sea area. Excessive heat pushed into the sea body by shipping or other ocean uses remains in the region – at least for some time or over annual seasons-, different from open ocean space and coastal bights. The high salinity of the sea surface layer, which increases the heaviness of the water, could increase the sinking ability of the water.
After all it there is a good chance – and necessity – to identify an serious contributor to excessive Red Sea warming: ocean use by shipping, fishing and deep sea exploration. Offering more clarification in this respect the King Abdullah University of Science and Technology could serve the climate change debate greatly.
Reference: Verinica. Chaidez, D. Dreano, S. Agusti, C. M. Duarte & I. Hoteit (KAUST- Aug.2017); “Decadal trends in Red Sea maximum surface temperature”
Ignoring off shore industry on climate change is irresponsible
Post: 23 October 2017 –
Climatology considers ‘natural variability’ as a valuable factor in climate change matters. Ignoring any human role in this respect is irresponsible. The latest big issue is floating off shore wind turbines with a structure about 78 meters submerged and 15 meters in diameters. Although a massive obstacle in a permanent moving marine environment the impact and change in ‘natural variability’ in climate change matters is completely ignored.
The concern has been raised in a recent post: ”Why Europe is warming up faster than elsewhere?” The matter is simple. Off shore installations affect sea temperatures and salinity structure at many locations to about 60 meters below the sea surface. In Europe the number of off shore wind turbines will account 4000 by the end of 2017. The inevitable consequence is at hand: “Northern European winters are getting warmer and warmer at a rate higher than global average” as analyzed in a paper by A. Bernaerts (2016).
Now the impact on sea level structure increase further. The world’s first floating wind farm opened on 18 October 2017, off the east coast of Scotland. The 6MW turbines rise 175m above sea level, and extend 78m below the surface of the water, tied to the sea bed by cables. The anchors used to stabilize the turbines stand at 16m and weigh 111 tons. (Details) Inevitable huge water masses of different temperature and salinity will change between the various sea levels. As an example see Fig. 2 (Northern North Sea – Section 1-4). The sea surface will warm or cool and either warm or cool the air temperature above the scene.
Any use of the oceans by mankind has an influence on thermo-haline structures within the water column from a few cm to 10m and more. Not even raising and investigating this mechanism is a demonstration that the use of the term “natural variability” is to hide pseudoscience.
___A. Bernaerts (2016), Offshore Wind-Parks and Northern Europe’s Mild Winters: Contribution from Ships, Fishery, et cetera? Journal of Shipping and Ocean Engineering 6, p. 46-56, HERE and HERE
Not bad faith may destroy civilization but ignorance in ocean matters.
Posted: 13th August 2017; Amanded 14/09 – below –
Links to WUWT and Fabio Maximus -below –
One can only highly appreciate how Paul Krugman requires a rational world to take urgent action to limit climate change in a recent NYT Opinion (Fig.1, 12/13 Aug.2017). His conclusion that the ‘tweeter in chief’ and the Republicans rejecting not just scientific evidence but also obvious lived experience, sound good, is true, but unfortunately in no way better as arguments from those he addresses as climate deniers or climate skeptics. They are mere nay-sayers to all scientific efforts in climate matters, or cry loudly hoax as the old Senator Jim Inhofe (R-Okla.).
To be clear; climate change is real. Climate change means a change in statistics, and climate statistics have permanently changed over the last several 100 million years. They have also changed since global industrialization started about 200 years ago. One eminent question is, to understand and minimize the role of humankind in this scenario; although the far more important question is, in what direction we are heading. Will it be warmer, will it be colder? The latter does not cross Paul Krugman’s mind. He is only able to discuss his points on the global-warming basis, and that is as ignorant as crying HOAX.
For 30 years we are deceived to believe human-caused warming of the atmosphere. That is naive and recklessly ignorant of the global proportion. Weather and climate is based on water in the air and in the sea; the ratio is 1:1000. More global warming requires many dozen years. The status of the 4°C warm ocean can shoot the world in a new ice age in few months. More than 95% of our past (Fig. 2) was much, very much colder than our present. A minor shift in this direction is definitely more and quicker destroying civilization as anything else, which we should understand and know pretty soon.
There is no axis of climate evil hampering the debate, but an axis of ignorance on all sides of the spectrum.
___FROM : the Fabius Maximus website;CONCLUDING: This is propaganda, characteristic of how activists have conducted their campaign to build support for massive public policy action to fight climate change. They’ve been at it since Hansen’s 1988 Senate testimony. It has not worked.
>>>>>>>EXTRACT>>>>>>>>“The other low-probability, high-impact threat is climate change fueled by increased human-caused carbon emissions. The truth is, if you simply trace the steady increase in costly extreme weather events — wildfires, floods, droughts and climate-related human migrations — the odds of human-driven global warming having a devastating impact on our planet are not low probability but high probability.”
Dear Mr. Friedman, Could you kindly consider the question:“One eminent question is, to understand and minimize the role of humankind in this scenario; although the far more important question is, in what direction we are heading. Will it be warmer, will it be colder?”
To understand and prevent anthropogenic climatic change by
sea activities check the impact of naval warfare during WWI & WWII
Posted: 27th July 2017
A recent paper by Shuai-Lei Yao et al (June 2017) explains: Global warming can be directly linked to ocean surface temperature changes, which is characterized by two weak slowdowns in the mid-twentieth century and early twenty-first century and two strong accelerations in the early and late twentieth century. But instead of considering the possible impact man’s ocean activities during the last 150 years, they merely acknowledge that “the cooling in the mid-twentieth century and distinct intensity differences between the slowdowns and accelerations remain unclear” (Nature, 2017).
While it is challenging to assess the impact of screw driven boats and vessels on the sea surface temperature, two of the four temperature shifts mentioned by Shuai-Lei Yao are strongly connected to the two World Wars, namely 1914-1918, which contributed to a global warming from 1918-1939 and 1939-1940, which may have caused a global cooling from 1940 to 1970. These two events penetrated the sea in a much more intensive manner as peacetime shipping and fishing would do. Even the scenarios between WWI and WWII are very different, but the difference is useful to demonstrate the correlation to the climatic shifts in question.
During the First World War naval warfare happened mainly around Great Britain. The sea temperature and salinity structure of the water body was changed, which all traveled northward towards the Arctic Ocean. Since 1918 air temperatures around Svalbard accelerated strongly, subsequently warming up the Northern Hemisphere until 1939 (in the U.S. until 1933). Naval activities in Europe caused in substantial shift in the ocean structure of the Nordic Sea and adjacent Arctic Ocean. (More HERE)
The naval war impact on climate during World War II was twofold, namely the three extreme winter 1939/40, 1940/41 and 1914/42 in Europe that started the global cooling for over three decades, and the naval war across the North Atlantic from 1939-1945 and in the Western Pacific from 1942 to 1945. (More HERE) The winters were caused by exhausting the reginal seas from the heat store during the summer much earlier than usually. The more serious impact on climate came with ocean wide naval activities. The ocean movements are highly sensitive to temperature and salinity structure. Only the most upper sea surface level sustains modest global air temperatures. Lower levels of a few dozen meters are colder, and the entire ocean with an average depth of about 3’300 meters is only +4° Celsius warm. Naval war penetrated the sea down to the bottom of the sea, which could be 10’000 meters.
Once naval war changed the sea structure the surface temperature is likely to change on multi-decadal timescales, which is with regard to the 20th Century closely related to post WWI warming 1918 to 1939, and the post WWII cooling 1940 to 1970. These two periods show how easy human activities can change climate, and that the often heard claim of “natural variability” is merely a long-standing mystery. When Marius Årthun et al (June 2017) observe that “the North Atlantic is the key provider of a predictable northern climate” they should extent their interest in the impact of human ocean activities. Even the newly appointed U.S. Energy Secretary Rick Perry considers ocean waters as control knob in climatic matters (CNBC-interview). At least some progress is made toward acknowledging that climate prediction resides in the ocean.
Climatology fails to consider a main contributor –
Maritime activities
Posted 1st June 2017
Activity at sea, whether by shipping, fishing or offshore drilling and windfarms is a big climate change issue. Not for climate research, ignoring this anthropogenic aspect completely. In the last few decades, Europe has warmed not only faster than the global average, but also faster than expected from anthropogenic greenhouse gas increases, says B-W. Dong, (et al., March,2017), which is known for some time (van Oldenborgh et al, 2009) . But how is it possible? The beloved culprit GHG is equally distributed around the globe. On the other hand the EEA [European Environment Agency] observed (Fig. 1): Over the past 25 years the rate of increase in sea surface temperature in all European seas has been about 10 times faster than the average rate of increase during the past century. In five European seas the warming occurs even more rapidly. In the North and Baltic Seas temperature rose five to six times faster than the global average over the past 25 years, and three times faster in the Black and Mediterranean Seas.( see: EEA-update 2015). Those are facts that must not be ignored (see PDF from: Journal of Shipping and Ocean Engineering ; Volume 7, 2016 and Box below).
Abbreviations: sea surface temperature (SST)/sea ice extent (SIE), anthropogenic greenhouse gases (GHGs), and anthropogenic aerosols (AAer).
Many ten-thousand screw driven vessels navigate the sea around Europe daily. Many thousand installations at sea, down to 100 meters and more, alter the highly variable sea structure concerning temperature and salinity day and night, during summer and winter. But nowhere is this an issue. The B-W. Dong paper restricts the investigation on ‘rapid summer warms’, with the meager result that: “The response to the increase in GHGs is mainly related to direct impact on clear sky downward longwave radiation and associated cloud and surface feedbacks. In response to changes in SST/SIE, it is the increased water vapour over Western Europe that leads to surface warming with positive surface and cloud feedbacks resulted from surface drying and the reduction in cloud cover.” That is hardly more informative as van Oldenborgh concluded back in 2009: ‘climate predictions for western Europe probably underestimate the effects of anthropogenic climate change’. Many dozen papers have been published ever since on the summer warming (see B-W. Dong), improving little.
It seems high time that climatology is willing to adopt a more focused approach. On one hand summer is by far the most difficult time period due to the impact of the sun. Look instead to the winter season and for example to the norther part of Europe and it is possible to explain that “Northern European winters are getting warmer and warmer at a rate higher than global average”, due to activity by man at sea, explained in detail by A. Bernaerts: HERE & in BOX BELOW
___ B.-W. Dong, et al (March 2017): Understanding the rapid summer warming and changes in temperature extremes since the mid-1990s over Western Europe
___Bernaerts, A. (2016): Offshore Wind-Parks and Northern Europe’s Mild Winters: Contribution from Ships, Fishery, et cetera? Journal of Shipping and Ocean Engineering ; Volume 7, Number 1, Jan.-Feb. 2017 (Serial Number 24), via the following LINKS:
“Why have skeptics countering the AGW meme
for few decades, but to little avail”
Post 06 April 2017
About a recent hearing on climate science by a House of Representative committee on 29th March, Tim Ball analyzed at WUWT“We Won Climate Battles, but Are Not Winning the Climate War: Here’s Why”.
The views were 1:3 at the expert table. One AGW proponent, M. Mann versus J. Curry, J. Christi, and R. Pielke jr, opposing (see image below). Although Tim Ball regards Mann’s claims as scientifically incorrect and the result of false computer model simulation, he assumes that Mann presented his case better and “won in the eyes of uninformed observers”, due to the inability of the “deniers” to provide definitive answers, and that most skeptics would not have done any better.
But why fail skeptics so thoroughly, and the distinguished Tim Ball as well, with his 25 years’ experience, as depict in his essay impressively. The main reason is that they or ‘deniers’ handle the climate change issue as superficial as main-stream climatology does, which is still largely stuck in a narrow minded view of 20th Century meteorology, for example:
__Neither side cares about reasonable definitions, respectively what is offered as terms for weather and climate are empty phrases, useless for any scientific work. (More on CLIMATE DEFINITION)
__If climate science is not able to explain climate events they refer to the term ’natural variability’; unable or unwilling to recognize that it is a physical process. (More on NATURAL VARIABILITY)
These two profound failures results from the fact that the oceans, as the driver of climate, is by far too studiously ignored in the debate over the last few decades, at least does not receive the observation and research investment, this vast weather and climate-machine requires. Back in 1942 H.U. Sverdrup told meteorologists that:
……the energy that maintains the atmospheric circulation is
to be greatly supplied by the oceans.
[“Oceanography for Meteorologists”, New York 1942, page 223.] Cited HERE
The most popular climate rule, ‘natural climate variability’, is utter nonsense.
In a recent post about global warming or climate change, Roy Spencer assumes that “we will not have much more scientific confidence ten years from now”. The problem is obvious when he wonders: “How much of recent warming has been natural?” He is not alone.
The climatologist likes to use the term ‘natural climate variability’, which is said to arise from two different sources: (1) internal variability from interactions among components of the climate system, for example, between the ocean and the atmosphere, and (2) natural external forcing, such as variations in the amount of radiation from the Sun. (Details: judithcurry.com/2016/08/08/). That is a complete irrelevant approach.
The global weather system is working according to the law of physics. The major components are water and heat. ‘Natural climate variability’, is screaming nonsense. In our previous post (HERE) we site C.F. Brooks (1918): “At all times, the diverse temperatures of water, land, and snow surfaces control weather details, which, when long continued, become large features “. The sentence is clear and leaves no room for ‘natural variability’.
The fact that the system is highly complex does not allow talking nonsense. Actually the inability to reasonable assessing and modeling the system is due to the largeness of the ocean water. With regard to the global heat system the ratio is roughly 1:1000, which means – very generally speaking – ocean observing may require a system that is one thousand-times larger than that currently used for observing the atmosphere. But instead of using a meaningless and misleading term “natural variability”, it is better to admit shortcomings, respectively to explain: ‘oceans-govern-climate’, and that more understanding and care for the oceans may minimize anthropogenic climate changes by improper ocean uses.
A Link between Atlantic sea-ice 1917
and US winter 1917/18?
Post: March 26, 2017
On one hand the Atlantic sea ice extent during summer 1917 is the only one ever observed (previous post), on the other hand only few month later the United States east of the Rockies winter 1917/18 was remarkably cold. It started with an unusual autumn, explained C.F. Brooks (1918): “The advance guard of our cold winter appeared on August 8 when a strong winter type of anticyclone, or “high,” entered the United States from the Canadian Northwest”. Could that mean that naval warfare in Europe via the low Arctic winter temperature 1916/17 (see previous post) , or sea ice condition summer 1917 in the North Atlantic, contributed to a record cold winter in the United States?
The 11-pages essay by C.F. Brooks mentions: “CONTROL OF THE WEATHER BY SURFACE TEMPERATURES. At all times, the diverse temperatures of water, land, and snow surfaces control weather details, which, when long continued, become large features. These surfaces affect not only the temperatures and moisture content of the winds, but also control the paths and strengths of cyclones and anticyclones. Water surfaces, whenever warm relative to the surrounding temperatures, always become centers of cyclonic activity and, therefore, are stormy. …cont” (PDF-HERE)
Naval war in Europe had a pronounced effect on sea water temperatures around Great Britain and in Northern North Atlantic; a contributing link to US winter condition 1917/18 is not impossible – if one takes Brooks’ remark seriously.
Charles F. Brooks; The “Old-Fashioned” Winter of 1917-18; Source: Geographical Review,Vol. 5, No. 5 (May, 1918), pp. 405-414 (free download PDF)
Never has such a high sea ice extent been observed in the North Atlantic as in summer 1917 (Fig.1a-1b). This exceptional case has never been investigated. Worst! Science seems not to have taken notice of it, even though thorough understanding of the event could possibly answer two important questions concerning climate change: FIRST: Contribute the late icing and subsequent melting process to the sudden extraordinary warming at Svalbard and polar region since winter 1918/19, (Fig.2)? SECOND: Contributed the naval war around Great Britain from1914 to 1918 (Fig. 3) to the exceptional icing, which lasted until 1939/40 (Fig. 4)? [A detailed WWI account –HERE]
Fig. 1b
Fig. 1c
Although air temperatures at Svalbard fell to all-time record low in winter 1917, sea ice conditions in March were usual (Fig. 1a). In general annual sea ice extent is highest in April, but succeeded average already in April 1917, but continued to rise to an unknown high level in May and June of 2017, which presumably has not happen for more than 200 years or longer. Even in late July the sea ice remained at an unusual high level. This late and extensive icing process may have had a pronounced impact and ocean water structure, from sea level to may hundred meter depth, which could have influenced the most significant climatic change in the 20th Century, namely the Arctic and Northern Hemisphere warming that started 18 months later in winter 1918/19 (Fig. 4).
Fig. 2
Fig. 3
Interesting that Willis Eschenbach observed a significant temperature discontinuity in the Northern North Atlantic at Vardo/Norway (Fig. 5) between 1917 and 1920. But he offers no explanation, neither mentions the naval war in Europe, nor the exceptional sea ice in summer 1917. A pity, the climatic developments in the North Atlantic during WWI could teach climate sciences many important lessons.
Japan under fire – cold is guaranteed –war-winter 1944/45
Posted March 10. 2017 – Comments welcome
The easiest way to grasp how climate works is to: Shell and bomb Japan severely over a couple of weeks and you will get an extreme cold winter in Japan. Here is the proof. Since late autumn 1944 the Allies warfare machinery could target location and ports in Japan, and merchant and war ships in all sea areas surrounding the island country. Immediately the winter 1944/45 (Dec/Jan/Feb) became the coldest on record since data were taken regularly, which should not come as surprise. (Fig. 1,2, and 7).
All sea areas around Japan are very deep and very cold. The average sea water temperature will hardly exceed 5 to 6 ° Celsius. Only the very top sea surface layer is up to about 15° warmer in the southern region (24°N), and only remotely higher in the North (40°N). But when several thousand merchant and warships, as well as many ten-thousand warplanes operate above, and below the sea surface, the extreme thin surface layer is ‘destroyed’ and replaced by much colder water.
Figure 4
The immediate result was inevitable. Japan’ winter 1944/45 (DJF) was the coldest on record. The deviation from average is very pronounced and particularly significant as it has to be attributed to man-made cause. How can climate change ever be understood, if science is unwilling and unable to understand and acknowledge such easy case on anthropogenic climate change?
Figure 6
Figure 7
Figure 8
More about WWII in the Pacific and Climate Change >>HERE>>
A paper by Judith Curry explains inherent flaws of computer models predicting future climate change (GWPF, Feb. 2017)
Post February 28, 2017
Not the ocean dimension and system is primarily to blame for flawed climate models but science, which does not recognizing that they have far too few data, even worst, not even been able to acknowledge that the ocean is the ultimate key to understand and protect climate from human influence.
Figure 2
A previous post appraised the clear language by Dr. Judith Curry in a BBC radio- interview on climate science’s inability and unwillingness to explain the warm-up 1910-1940 and cooling 1940 to 1970. Few days ago the Global Warming Policy Foundation (GWPF) released her 30 page long paper “CLIMATE MODELS for the layman”. The paper emphasizes: The IPCC does not have convincing explanations for previous 30-year periods in the 20th century, notably the warming from 1910 to 1940 and the grand hiatus of 1940–1975”. We addressed the matter HERE. Nevertheless the paper’s deficiency is its ignorance of ocean matters, while the little that is said, shows a far too narrow view.
At page 8 the paragraph ‘chaos and natural internal climate variability’ mention as external forcing solar variations, volcanic eruptions or changes in atmospheric composition such as an increase in carbon dioxide, but not the oceans. They are merely addressed with reference to El Niño/La Niña, and as internal processes within the climate system (internal variability). That indicates gross ignorance. The El Niño phenomenon is only an extreme small fraction of the ocean dimension and within the ocean system, as each square-meter at the sea surface and any cubic-meter at any ocean-depth play a comparable role all over the world.
In so far we recommend reading Guest essay by Mike Jonas at WUWT on ocean heat, which explains the intake on a daily basis, whereby solar energy is absorbed into the top fraction of a millimetre of the ocean then mixes (conducts and convects) into the top 5-10m only, and nearly all of it stays in just the top (see Fig. 2).
On the other hand Mike Jones is wrong if he subsequently assumes that during every subsequent night, all heat is lost, back into the atmosphere. This assumption ignores that immediately after any heat intake, the warmed-up water is part of the horizontal and vertical sea current system and furthermore may be pushed down by sea waves (~ 3 Bft.+) or propeller driven vessels (or other human activities) to much greater depths. For example, a hurricane can push water from the sea surface layer down to about 50 meters. From there the water moves on, and the heat may only released back to the atmosphere after several days or many years. In this way international shipping presumably has significantly contributed to the global warming since the late 20th Century. Climate models must fail if not feed correspondingly.
The SST Discontinuity in the 1940s – But no answer
Post 25 February 2017 ; Comments welcome
Few years ago David W.J. Thompson at al. attempt to explain “A large discontinuity in the mid-twentieth century in observed global-mean surface temperature“, published in NATURE, [Vol.453, 29May2008]. Whereas they confirmed that the Earth warmed from 1910 to1940 the subsequent cooling is explained very superficially, namely by a “variety of physical factors, such as atmosphere–ocean interactions and anthropogenic emissions of sulphate aerosols” and of “uncorrected instrumental biases in the sea surface temperature record”. That the large discontinuity has a strong correlation with World War II is not even mentioned. Fig. 1 & Fig. 5 (Source: HERE)
Immediately Bob Tisdale (2009) question the conclusion, due to obvious similarities in the shifts of the SST , the cloud cover and the marine air temperature datasets (HERE),but either ignoring human activities at sea in the 1940s as well. One dozen years earlier two papers discussed “Temperature taken during World War II” [Pacific; Atlantic], by showing that a huge variety of observation need to be analyzed before considering any ‘corrections’. But as Tisdale wonders that Thomson et al pay not any attention to other datasets showing the discontinuity as well, he either is short in asking the question: What is the cause of the observed discontinuity in the 1940s.
The convincing answer is presumably not very far away. Since September 1939 huge water masses were churned up-side-down, as a recent post mentioned. As many ten-thousand ships plugged the sea every day, and billion objects exploded and sunk to the bottom of the sea, over several dozen meters or few thousand kilometers. Aerial bombs, torpedoes and depth charges proved particularly effective. The photos are self-explanatory. One can only wonder that interest in any human impact on climate by activities at sea hardly exists.
In the previous post we lauded Dr. Judith Curry for her recent statement: “If science can’t explain climate shifts pre 1950, how can we trust today’s climate models?” One of these two shifts was the warming from 1918-1939, we covered: HERE; while the very significant global cooling period from winter 1939/40 to mid-1970s is our topic today, as it is either a widely unexplored field. In our view: the models fail because this cooling was man-made due to naval war during World War Second (WWII), at least according the work of Dr. Arnd Bernaerts (Book 2004
Fig. 2 – Northern Europe T°C
and Book 2012). With reference to them, we will try to explain a prima facie connection between these events, and how easy man can interfere with nature and initiate a pronounced climatic change.
Actually, not the impact of two brief naval wars on climate should be a top scientific agenda, but propeller driven motor ships. Many hundred-thousand ships transverse the oceans, up to 500 miles and more every day. During the last 170 years any ship at sea mixes the surface layer down to 20 meters and more, usually forcing more heat into the sea body than forcing colder water toward the surface. Much of the warming of global air temperature since about 1850 might have been caused in this way. Any proof in this respect is currently unavailable, as science is not aware of this point, even worse, incapable to recognize the oceans as principle driver of climate.
This scientific gap could be sufficiently eliminated by analyzing two short time periods of naval warfare during the two World Wars, while recognizing the different mechanisms that caused warming from 1918 to winter 1993/40 (HERE), and the global cooling thereon until about 1975. While the former period could be localized to an area from Great Britain to the Atlantic section in the Arctic Ocean, the caus
Fig. 3 – Three extreme war winters in Europe 1939/40, 1940/41 and 1941/42
es of the latter period cover the entire North Atlantic (1939-1945) and the Pacific west of Hawaii (1941-1945), both with a very complex temperature, salinity and current structure, great depths, and temperatures of merely about 4°C. In this delicate marine environment, many ten-thousand war ships plugged the sea, and may billion objects exploded and sank to the bottom of the sea, over several dozen meters or thousand kilometers. Impossible that the sea structure (temperature and salinity) was not severely affected, and the ‘natural sea current profile’ not so heavily altered and diverted that it took at least one generation to erase the war impact, which lasted until about the 1970s. The attached temperature maps hardly allow another conclusion. As science has done nothing for proving anything in this respect, the impact of naval warfare on weather can be proven during the three extreme war winters in Europe 1939/40, 1940/41 and 1941/42, which came unexpected, and were in wide regions the coldest periods for more than 100 years.
With some interest and effort the three war winter can be sufficiently connected to human activities in the North Sea and Baltic since September 1939, due to the fact that these seas are fairly shallow (90m/55m), storing heat during the summer and releasing it in winter. It works like spoon stirring hot coffee, attracting cold air from Siberia (More HERE). In this respect they serve as confined research regions, like a unique field laboratory experiment. Each of the three winters produced its own finger-print, of which the most prominent are mentioned.
Winter 1939/40: From 1st September 1039 on the Southern North and Baltic Sea were covered by unprecedented activities from navigation, shelling, bombing, sea mines and so on. Very soon temperature fell from Brussels to Kaliningrad to levels not seen for several generations, and sea ice cover for many dozen years. In Berlin January and February temperature were second to the coldest ever recorded after 1709.
Fig. 4; Mid-January 1940
Fig. 5; Jan/Feb 1940
Fig. 6; Mid_February 1940
Winter 1940/4: During 1940 military activities concentrated from Narvik to Brest, and since April while occupying Norway, particularly affecting the Skagerrak aera. Subsequently the winter ‘cold pole’ covered Southern Norway, Western Sweden and Northern Denmark.
Winter 1941/42 is a particular illustrative case. The ambush on Russia since June 1941, included intensive naval warfare in the Eastern Baltic over seven months until sea ice prevented further activities. The Baltic region was thrown back to Little Ice Age condition, for example into the coldest winter in Stockholm since 1756, and unbelievable condition in Tallinn – see Fig. 9.
Fig. 7; Winter Denmark
Fig. 8; Winter Stockholm
Fig. 9; Winter Tallinn
In Summary all three winters are so closely connected to naval war activities (outlined in detail over 160 pages – HERE that ongoing ignorance is irresponsible. Any proof, whether by a minor or high percentage, would ultimately require an indepth research on naval warfare on the global cooling 1940-1970s, and subsequently of merchant shipping and other ocean uses on global warming since 1850, which would quickly stand correctly for ‘AGW’ (anthropogenic global warming).
NOTE: The next post explicate a few further aspects on “Warming and Cooling since 1850″.
Dr. Judith Curry speaks out on climate science’s fatal flaw –
the failure to explore and understand uncertainty
Post: February 10, 2017 ; Comments welcome
Dr. Judith Curry speaks out on climate science’s fatal flaw but does she understand the climate change matter at least a little bit better? Unfortunately not, or have you heard her ever talking on the overwhelming predominate influence of the seas?
It was in a recent interview on British radio, February 6th [More at WUWT] that she mentioned climate science’s fatal flaw – the failure to explore and understand uncertainty, as a yet unaddressed issues of how ‘natural climate change’ drivers impact the earth’s climate, which indicates: Not understood’.
Judith Curry is to praise when mentioning: ___”If science can’t explain climate shifts pre 1950, how can we trust today’s climate models?”, and that ___“……the models fail to simulate the observed warming between 1910 and 1940.”
Actually, both time periods are closely correlated with the two great naval war activities about 10 and 7 decades ago. World War I presumably initiated the extreme warming from about winter 1918/19 to winter 1939/40, which saw the commencement of a three decades long global cooling. That is anthropogenic making pure and presumably one reason because computer models fail. But surely not alone!
More important is the most basic lack of understanding. Earth weather (and subsequently ‘climate’) is based on the law of physics. In this system the ration between ocean and atmosphere is 1000:3, in regard to average temperature about +4°C to 14°C. The vast dominance of the oceans concerning physical parameters is very obvious. If it is too big to understand, to assess, and to feed into computer models, should not allow speaking instead about ‘natural climate change’. A thorough investigation of the impact of the World Wars on the most pronounced climatic shifts since the end of the Little Ice Age about 170 years ago will demonstrate how easy major human activities – at sea – even over a short period of time may influence weather (and climate).
At the end of the interview Dr. Curry encourage people “who have concerns about the validity of arguments alleging man made climate change to continue to speak out about their concerns”, which we pick up by adding to the reasoning above: Any reference to “natural climate change’ undermines serious climate research.
More at WUWT: https://wattsupwiththat.com/2017/02/09/dr-judith-curry-speaks-out-on-climate-sciences-fatal-flaw-the-failure-to-explore-and-understand-uncertainty/
Not understood: https://oceansgovernclimate.com/703-2/
The 1940s produced four extreme winters
Met-Office recognize only 1947
Post January 29, 2017 _ Comments OPEN
In a recent post the Met-Office asked its reader: “If you’re old enough to remember 1947, then you’ll almost certainly have the winter as one of your most vivid memories of the year. For meteorologists and climatologists, the winter of 1947 was a standout year for the UK…. “, accentuated also about two years ago in: “Severe Winters”. Why not asking for other winters?
Actually the 1940s produced four extreme winters, during the first three war winters 1939/40 t0 1941/42 and 1946/47. Compare the corresponding temperature anomalies in the first winter 1939/40 with those in winter 1946/47 and the comparability is easily assessable.
Surprisingly the Met-Office shows little interest to investigate what generated the extraordinary winter. They came suddenly and totally unexpected. All winter in the decade before WWII had been the warmest since the end of the Little Ice Age. The sudden arrival of three extreme winters can be convincingly explained by naval war activities. More HERE-1.
Even the winter 1946/47 which was particularly pronounced in Western-Europe, in countries close to the North Sea and Atlantic, a connection the WWII is a strong option, as discussed HERE-2.
It is time that Met.-Office awakes, and does what it should have done since long, telling us, what triggered the severe winters in Europe in the 1940s.
“Now testing the waters: Wind power”, titles the NYT an article concerning the first US off shore wind farm about three miles off Rhode Island. The operating started in last December. Reading the article and the company’s environmental assessment, one can only wonder about the ignorance concerning the impact seem to be in place.
The four-legs steel installations cover a depth of about 80 feet (~25 meters). The water column is permanently in move, horizontal and vertical. The water column has a high verity of temperature and salinity. Each installed object cause a mixing and change of current direction; 24 hours a day. Warmer or colder water may reach the sea surface, that inevitable alter the air temperature.
Five off shore installations is not a big matter. Shocking should be the incompetence in ocean matters. There will be soon many more wind turbines installed. There are approximately 2,500 wind turbines spinning in the ocean off the coast of Europe today. That is likely to have already a pronounced effect on the winters in Europe, particularly as far as the North Sea and Baltic Sea are concerned. More HERE and HERE. Whether the “Europeans warm their winters” could be fairly easily proven if science, public servants and companies would acknowledge that oceans-govern-climate, and care accordingly.
Massive Data Tampering Uncovered At NASA? The subject was recently discussed at NTZ (and illustrated with multiple graphs). With regard to two events they indicate simultaneously the same: A steep rise in temperature after World War One (WWI), and a large temperature drop when World War Two commenced in late 1939; as shown in the graphic from 1981.
In 1981, James Hansen was the Director of the NASA Goddard Institute for Space Studies. He was also the lead author of a seminal paper published in the prestigious journal Science entitled “Climate Impact of Increasing Atmospheric Carbon Dioxide“. In the paper, Hansen and his colleagues reported a rapid warming in the Northern Hemisphere of between +0.8 and +1.0°C between the 1880s and 1940, which then cooled by ~0.5°C between 1940 and 1970.
Already the length of the first Period 1880 to 1940 Hansen and colleagues interpreted wrong, which should have been divided in two parts:
Phase A) 1880 to WWI indicate a modest cooling by 0.1°C; and
Phase B) From the end of WWI to 1939 showing a steep temperature rise of about 0,9°C.
In addition they should have shown interest in the fact that the temperature turnaround commenced together with World War II around late 1939.
How could NASA scientists miss the clears signs of a strong correlation between the two World Wars and major climatic shifts during the first half of the 20th Century in 1981 (Further Reading ). How could they remain beaten with blindness until today?
Claiming “natural variability” indicates: Not understood!
posted January 15, 2017; Comment open
Talking about “natural variability” is a sign that the research issue is not understood. But climate science loves the term. So do Chantal Camenisch and her 32 colleagues in their recent paper (A) concerning a climate reconstruction from a multitude of natural and anthropogenic archives, which indicates that the 1430s were the coldest decade in north-western and central Europe in the 15th century.
Interesting is their conclusion that neither volcanic eruptions nor a reduction in solar forcing on temperature seasonality can explain these winters in the 1430s, although attached images indicate that air temperatures and precipitation may have been strongly influenced by the Eastern Atlantic from Spain to Ireland and the North and Baltic Sea.
Instead of admitting that they are unable to identify the cause, they say: “The climate models showed instead that these conditions were due to natural variations in the climate system, a combination of natural factors that occurred by chance and meant Europe had very cold winters and normal to warm summers”.
Instead of admitting that they have not yet grasped that oceans-govern-climate, they claim “natural variability” ignoring that weather (and climate) work according physical laws. Worst, by not even saying what that term means. Do they think that “Natural climate variability, as the name suggests, is caused by natural factors.”? (see: know.climateofconcern.org) What nonsense! Applying the law of physics in the weather-world might be often difficult due to complexity and lack of data, but using instead ‘natural variability” is unacceptable and strongly misleading.
Chantal Camenisch et al: The 1430s: a cold period of extraordinary internal climate variability during the early Spörer minimum with social and economic impacts in north-western and central Europe; Past, 12, 2107–2126, 2016, www.clim-past.net/12/2107/2016/; doi:10.5194/cp-12-2107-2016; FULL text in PDF (p.20): http://www.clim-past.net/12/2107/2016/cp-12-2107-2016.pdf
“To investigatethe sudden extinction of the dinosaurs about sixty six million years ago, the scientists for the first time used a specific kind of computer simulation normally applied in different contexts, a climate model coupling atmosphere, ocean and sea ice”; says PIK. However little information is provided about data and possible role of the ocean,
Instead the only physical reference is according Julia Brugger from the Potsdam Institute for Climate Impact Research (PIK), and lead author of the study: “The big chill following the impact of the asteroid that formed the Chicxulub crater in Mexico is a turning point in Earth history.” [Publ. 13.Jan.2017]That is certainly too petty-minded view, when the global annual mean surface air temperature dropped by at least 26 degrees Celsius.
It is the common problem with PIK. They build on research showing that sulfur-bearing gases that evaporated from the violent asteroid impact on our planet’s surface were the main factor for blocking the sunlight and cooling down Earth. No word about the role of the oceans with an average temperatures as low as about 4°C. Ocean dimension matter, as well is their service to the atmosphere with regard to temperature, evaporation, humidity, wind and ice-cover. This is another annoying example by many scientists to disguise their fuddy-duddy research on “computer simulation”.
Reference: Julia Brugger, Georg Feulner, Stefan Petri. (2017) Baby, it’s cold outside: Climate model simulations of the effects of the asteroid impact at the end of the Cretaceous. Geophysical Research Letters, 2016; DOI: 10.1002/2016GL072241
Should AGW sceptics understand what they are talking about? Of course! Let’s have a look at the critical view of Alan Carlin expressed in a recent post (Dec.30,2016): “Why Climate Alarmists Have Missed the Big Picture”. He claims that “There is evidence that very minor changes in the incidence of sunlight on Earth can and have resulted in plunging Earth and all its living cargo into new ice ages”. It is not the sun but the oceans, and Alan Carlin, as a sceptic for many years, should know it.
Back in 2009 Alan Carlin, an economist and senior analyst at the EPA (US Environmental Protection Agency), became a sudden celebrity with the surfacing of a few e-mail messages that seemed to show that his contrarian views on global warming had been suppressed by his superiors (NYT). It seems he did not use his new influence well, but ignored further on the relevance of the oceans in climate matters, as outlined HERE, HERE & HERE.
However, Alan Carlin rightly warns about the major climatic risk, namely “that Earth will plunge into a new ice age, with global temperatures ultimately reaching perhaps 6 to 8°C below current temperatures.” Presumably lower annual temperature of just 1-2°C, are enough for a serious threat, and the oceans are so cold that it can happen within a few months or years.
Cold Ocean – The best kept secret in the ‘climate world?
Posted December 28. 2016
“The best kept secret in the ‘climate world’ probably is: the cooling capacity of the deep sea. Some attention is paid to the heat uptake by the oceans, but there is no attention for the cooling capacity of the deep sea. That capacity is huge and might be (and might have been) of decisive importance in climate and climate change”; says Wim Röst in a guest past at WUWT (26.Dec.2016).
The assessment is important, and the essay is recommended to be read due to the fine presentation of the oceanic dimension and temperature structure. But if Röst assume “Warming by [less] Upwelling of Cold Ocean Water”, he is speculating, as no data in this respect have been collected. Even if several ten-thousand devices would be put in place, it would require several dozen decades, before it might be possible to analyze a globally relevant correlation.
As outlined in a previous post (HERE) the only prolonged cooling period since 1850 occurred simultaneously together with the sinking of many ten-thousands of ships and air-planes, and billions of ammunition, as shells, torpedoes and depth-charges, arial bombs. Not only the surface layer is affected, but the entire water column, sometimes down to 10’000 meters, with the inevitable impact that cold water is pushed to the sea surface layer. The net result is cooling.
After decades of warming, suddenly winter 1939/40 became the coldest in Europe in more than 100 years, which was the beginning of a global cooling for more than three decades. The reason has never been seriously investigated, although World War Two represents an unprecedented field experiment. Instead of assessing the impact of naval warfare on weather and climate, the discussion is merely about the interpretation of temperature statistics, as indicated in the two images. Are they misinterpreted?
The full title of a recent post at WUWT (Dec.15, 2016) is: “Global Cooling and Wikipedia Fake News”, referring to:
___an excellent new post up at notrickszone.com (Sept.13, 2016) on the global cooling scare of the 1970’s and the efforts to erase it from the record by the climate alarmists at realclimate.com. For some the scandal at Wikipedia over William Connolley deliberately posting false articles and altering factual ones on climate is old news. This is for those who missed the story. William Connolley created or rewrote 5,428 unique Wikipedia articles. “Fake news” is an old story, used extensively by radical climate alarmists and environmentalists. Indeed, Greenpeace seems to be based on the concept of fake news.” More at NTZ. As NTZ mention:
___”, it is plainly evident that there was a great deal of concern about the ongoing global cooling, which had amounted to -0.5°C in the Northern Hemisphere and -0.3°C globally between the 1940s and 1970s.”,
one need only to ask what did naval warfare contribute since September 1939, to the extreme winters in Europe and global Temperature decline, noting that naval war took place primarily in the Northern Hemisphere, which resulted in lower mean temperatures than globally over several decades.
Incompetence in ocean matters continues. Adolf Hitler in WWII – Climatology ever since!
The New York Time brought the news on the front page of the December 9th 1941 issue: “US declares war” and that the “Nazis give up idea of Moscow in 1941. Winter forces abandoning big drives in the north (N- Europe) until spring, Berlin says”. Since November temperature and snow conditions became worse than the wildest imagination. What is not known is that Hitler could only blame himself and his weather-advisors for this enormous miscalculation. They had expected a mild winter. (More) They had not learned anything from the previous two cold winters 1939/40 and 1940/41, and the role that naval war had played.
And again, Hitler’s great field experiment in climate-change by naval war in the seas around Europe showed quick and thorough results. Europe was unexpectedly back in the Little Ice Age. A number of locations got the coldest winter ever recorded. The ‘great commander’ had shot himself in the back. The weather conditions Hitler’s warfare forced to arrive marked the beginning of the end of the Third Reich.
And what did climatology learn from this “experiment”? Nothing! They never even showed any interest in the three war winters 1939/40-1941/42 (More: essay in PDF, 13 pages . . Anyone who claims to understand climate change must also be able to explain these events. Anyone who can explain these events will recognize that the oceans play the key role in any and all questions of the climate.
“It’s crazy.” Since 2006, the Arctic Report Card is issued annually, and the four dozen authors, miss the most fundamental aspect in their annual review ever since; facts and discussion of changes in the sea water structure concerning temperatures and salinity. There are hundreds of military, commercial , research and leisure ships navigating the open and ice covered Arctic Ocean, but science is not even able to mention the threat by human activities. That is crazy.
While it is a fact that a persistent warming trend and loss of sea ice trigger Arctic changes, it is necessary to acknowledge that the prime source is the sea water column, which is extreme sensitive to human activities (see image), particularly in those sea areas which are ice covered. But the repot does neither acknowledge this aspect, nor does it offer any information. Instead the “surface air temperature” is in focus and one of the leading scientists Mark Serreze, is quoted: “Personally, I would have to say that this last year has been the most extreme year for the Arctic that I have ever seen. It’s crazy.” Indeed, the report is waste of time and money without details on changes in the water column, and telling the public about any possible impact scientific research and other activities in the Arctic may have on air temperature and sea ice cover.
Soon Shinzo Abe is to make a historic visit to Pearl Harbour, the first by a Japanese leader. By a devastating sneak attack on Pearl Harbour on Dec. 7, 1941, a prolonged naval war across the Western Pacific commenced. This naval war pushed the Pacific in a cooling mood, contributing to the global cooling period from 1940 to the mid-1970s. The dramatic shift in the early 1940s in the “Pacific Decadal Oscillation” (PDO) is known for decades, but nothing about its causation. Science is unaware of the profound correlation between naval warfare and its impact on climate, and that after 75 years have passed. A profound analysis is HERE.
This major topic in a world that fears anthropogenic climate change will not be raised during the meeting of Abe with Obama in Pearl Harbor on Dec. 26 and 27. Decades have passed and no lesson learned from the impact of many thousand warship and several ten-thousand air planes involved in dozen of naval activities; bombing, torpedoing, shelling, and ploughing the sea. Any activity penetrated and revolved the sea down to dozen, in many cases down to several hundred meters. Many million objects, vessels, air planes, shells, torpedoes, and so on, sunk to the sea bottom, sometimes over many thousand meters.
It was a grand human filed experiment on climate change. It worked perfectly, while world leader pretend doing everything to minimise human caused climate change, are still unable to see the only benefit the naval war has offered: to understand Oceans Govern Climate. What a failure!
Why do models disagree on temperature variability?
Climate models have problems. The problems are as old as science attempts to understand climate change by model simulation. That will last until a thorough ocean observation system is in place, and overriding impact of the oceans on climate is accepted, understood and applied in climate sciences..
Since it is known that unforced GMST (‘global mean surface temperature’ ) variability is heavily influenced by tropical Pacific surface temperatures, it might be tempting to suppose that the large inter-model spread in the simulated magnitude of GMST variability is due to model disagreement in the amount of simulated tropical Pacific variability. Perhaps surprisingly, our study shows that this is not the case and that the spread in the magnitude of model-simulated GMST variability is linked much more strongly to model disagreements over high-latitude oceans. Our findings suggesting that improving the simulation of air-sea interaction in these high-latitude ocean regions could narrow the range of simulated GMST variability, advance our fundamental understanding of natural variability, and appreciably improve our ability to forecast global warming on policy-relevant timescales.
With this understanding science is unlikely to make any progress, as the analysis ignores completely the changing of internal oceanic forces, with a physical capacity 1’000 times higher as of the atmosphere. However it is to acknowledge that Dr. Brown realizes that further progress is not possible without more attention to the sea.
Emerge now the unique chance to review the whole climate change matter, since Donald Trump selected the sceptic Scott Pruitt to serve as the head of the Environmental Protection Agency (EPA). The pick of the Oklahoma Attorney General has been described as “putting an arsonist in charge of fighting fires”, with some warning “the whole country is in danger”, even an “existential threat to the planet”.
The concern has merits, but is that Pruitt’s fault? Could Pruitt be not right when casting doubt on whether human activity is causing the planet to warm – in opposite to 97% of the scientific community? For sure if he addresses only the arrogance of the 97% who believe in the warming by carbon dioxide, but wrong if Pruitt would generally deny a serious correlation between human activities and global warming since industrialization during the last 170 years; as the oceans matter.
Since the end of the Little Ice Age about 1850, huge shipping fleets plough through the sea, pushing more heat in the sea, as the sea can release again soon. The net result is warming the seas. Due to human activities at sea the oceans warm, and the atmosphere as well. But as 97% of the scientific community is ignorant in this respect, main stream science lack the arguments to challenge President-elect Donald Trump and soon-to-be EPA chief Scott Pruitt on anthropogenic climate change matters. They should blame themselves if the protection of climate is not addressed appropriate.
The future first daughter is reportedly planning to make climate change one of her signature issues. On Monday the 5th of DecemberIvanka Trump met with former Vice President Al Gore to discuss “climate issues”. After the meeting, Gore disclosed he had also met with the president-elect, describing the conversation as “very productive” and a “sincere search for areas of common ground.”
Holy Molly what is Rep Senator Jim Inhofe going to say, who calls Climate change talking the “Greatest Hoax”, confirming this assessment in a statement only one month ago: “Americans do not support …economically damaging mandates that have no measurable impact to climate change.” (More HERE) That hardly fits together. On one side a man who once said that “the world had until 27th January 2016 to end its addiction to fossil fuels or it would come to an end; and on the other hand someone who promises to “make America great again”. How those shall work, and worst if based on a far too narrow knowledge base – as outlined in the pervious post.
But hope moves mountains, as an Opinion by Thomas L Friedman in the NYT (Int. Edition 12/08/16)* indicates: “I don’t expect Trump to abandon his effort to increase oil drilling or to ban coal”; while concluding his text with the hope: “As long as Trump is open to learning on the environment, we have to push our best and brightest through the doors of Trump Tower to constructively engage him”.
That leaves here only room for two questions.
(A) Belongs Al Gore to the brightest in America?
(B) Have there been serious indication over the last 12 months, that the President-elect is able and willing to learn?
Even it is eventually a little bit the case, are Jim Inhofe and his colleagues not immediately crying fool?
Contrary to all expectation, can ‘a Beauty and a Beast’ make a difference?
*) NYT, Thursday, December 8, 2016, p1 &13: “Say what, AL, Donald and Ivanka” Opinion by Thomas L. Friedman.
James Inhofe (R-Okl.): Global Warming is Greatest Hoax.
Posted 07 December 2016: Comments: open
On Wednesday November 9, 2016, U.S. Sen. Jim Inhofe (R-Okla.), chairman of the Senate Environment and Public Works (EPW), released a statement on future of the United States’ commitment to the Paris Agreement (A).
If someone regards global warming as the conspiracy and has written a book about the subject (B) in which he claimed that “our rigorous oversight of the IPCC began with my “Greatest Hoax” speech in 2003”, the announcements made four weeks ago, “that a future administration will have numerous options to forego political commitments under the Paris Agreement” will change the general scenario considerably.
Presumably Jim Inhofe talk is as much vacuous as that of his opponents is. Both ignore the fundamental climate driver, the oceans. Both are incapable to define the term CLIMATE in a meaningful manner (more here). To deny ‘global warming’ over the last 150 years since the end of the Little Ice Age is as ignorant, as the claim by his opponents on AGW by carbon dioxide.
The Republicans are soon in a comfortable position to challenge IPCC and the Paris Accord. It would be time for J. Inhofe to look more serious into the matter, ensure that wrong facts, or a gut instinct, are used to formulate politics to minimize anthropogenic interference in weather matters, which is a highly possible issue, if one no longer ignores, human ocean uses since the mid-19th Century.
Posted December 03, 2016; NOTE: Comments Section Activated
A recent paper (A) by 32 scientists assume, “that the 1430s were the coldest decade in north-western and central Europe in the 15th century, and that this decade is characterised by cold winters and average to warm summers”. No surprise that WUWT titled the story: “Cold Kills: The coldest decade of the millennium”, but merely asking: “cold kills, so why all the whining about warming?”(B), while remaining silent about the papers notion, that “…these conditions occurred by chance due to the partly chaotic internal variability within the climate system”. This is shocking. What is “internal variability”?
Leading scientists seem incapable to understand that climate (and weather) is physics, plain physics, and that the oceans, next to the sun, are the driver of the system. The oceans are so big and so cold that they can provide a cooling within a few months, sustain it over years and generate a new ice age. Referring to internal variability is a confession of failure. Chantal Camenisch and her colleagues lack the necessary competence, if they are not even able to ask what influence the oceans might have had. Why are they not being challenged to explain that the oceans have, or not have contributed? Not mentioning the oceans at all is a serious scientific default.
Ocean average temperature is only about 4 ° Celsius
The name “oceansgovernclimate” is program. Measures to protect climate without profound information and understanding of the oceans are costly, insufficient, and delay action to prevent anthropogenic “ocean change” that probably cause climate change. Since long we support the fascinating theory on the impact of naval war on climate, as outlined in the “Booklet on Naval War changes Climate”. The two World Wars demonstrate conclusively how easy human activities induce alteration in the sea-structure that leads to climatic changes. ‘Human activities’ cover everything, from shipping, fishing, leisure boats, and off-shore platforms. In so far the two major naval wars served as ‘large field experiments’, as summarized in the conclusion of the Booklet “Can WWII go by unnoticed?”, from which the following excerpts (p. 94f, PDF) are taken:
QUOTE. “The aim of the book was to leave no doubt that the ocean determined where the climate was heading to. In this scenario, CO2 played only a minor role. CO2 was definitely neither the source of the “Big Warming Bang” (in 1918, far in the North of the North Atlantic), nor of the global cooling (from 1939 until the 1980’s).
Oceans and seas are very complex, which are not well-understood not even today. But war at sea during two major world wars was a tremendous force that has left its trace on the oceans. Two climate changes during the last century prove our thesis. Winter temperature had risen in Spitsbergen with 8ºC (1918–1939). The whole Europe got warmer every year. The German Chancellor Adolph Hitler started the war in 1939 and immediately North Europe was dragged back into the Little Ice Age, which implied climatic conditions not experienced for over 100 years. Two arctic war winters followed in the region with extreme naval activities until the war at sea went global, in 1942. And what followed immediately after that? There were four decades of global cooling, affecting particularly the Northern Hemisphere, because here naval war had the most devastating effects and left a definite fingerprint in the downturn of global temperatures. Even though our book section on naval warfare between 1942 and 1945 is short, the connection between naval forces and global cooling is overwhelmingly convincing.
Winter temperatures of more than 5ºC below average are totally out of tune. Weather statistics cried for attention, but nothing happened in this respect over more than six decades. Until now, only one of the most ruthless WWII warmongers, the German Vice-Chancellor Hermann Goering, commented the arctic winter of 1939/40 by saying that a higher power has “sent” the harsh winter conditions. It is time to prove him wrong and to blame him, Hitler and the Nazis for having caused the arctic war winters and the global cooling………………
So far, the statements seem to contradict each other. But in a wider sense, they are pretty logical. Someone who claims to be able to explain current global warming must implicitly be able to explain a pronounced global cooling which affected the climate only half a century ago. Ignoring the event for more than six decades is even more bizarre than relating phenomena to a ‘higher power’.
If this investigation succeeds in proving that two major wars changed the course of the climate twice in the last century, it will also prove that shipping, fishing, off-shore drilling, and other ocean uses had constantly contributed to the global warming since the start of industrialization, more than 150 years ago.
A new chapter on the climate change issue could be now opened, giving more attention to oceanic phenomena under the influence of the potential of the “1982 United Nations Convention on the Law of the Sea”. All research would lead to a better understanding and protection of the stability of our short-term weather and long-term global climate.” UNQUOTE
Material available at: http://www.1ocean-1climate.com/.
Tony Heller (HERE) calls the idea that it’s getting hotter “utter nonsense”, and being due to “station data loss and fabrication”, indicating that NASA “erased” the once unanimously agreed cooling from 1940 – 1970; (Fig. 1) Heller, who goes by the pseudo-name of Steve Goddard at his wildly popular realclimatecience site, highlights some of the many ridiculous claims climate experts and activist politicians made, and have since turned out to be a complete folly, assuming “climate data is being manipulated to increase alarm“. See more
The two big climatic shifts are not sun but ocean allocatable
The problem is that NASA seems feeling obliged to erase the global cooling (1940 to mid 1970), while skeptics are satisfied to do a bit or some bigger complaining. Neither side seems able and willing to explain the pronounced three decades long global cooling (Fig.2), which correlates with naval warfare in Europe, across the Atlantic and Western Pacific since September 1939 until August 1945, definitely a man-made cause. For more see the following links:
Bombshell study: past El Niño’s ‘may have amplified
global climate fluctuations for hundreds of years at a time’ *)
The new work from AUSTRALIAN NATIONAL UNIVERSITY found periods of predominantly El Niño-like patterns for several hundred years that alternate with La Niña patterns, impacting on global climate over the last 2000 years. What does it tell us? Oceans govern climate! The sea surface area of an El Niño event is extreme small compared with the entire global ocean space. How shall such tiny sea area contribute significantly to global warming, asks a recent post?. The ocean interior is what matters. No surprise that the lead author Dr Michael Griffiths from William Paterson University /USA explains: “Until we can model this lower-frequency behavior in the tropical Pacific, one can only speculate on how the warming will play out over the next few decades”. Unfortunate this view is by far too narrow. Reducing such issue on the ‘tropical Pacific’ is appalling naïve. All ocean space from top to the bottom (3’500 meters), contributes to climate change. This inability to see the entire picture on what governs climate is the real threat to the world fearing climate change. .
According NASA: “97 percent of climate scientists agree: Climate-warming trends over the past century are extremely likely due to human activities.” (1) The Guardian is even blunter: “It’s settled: 90–100% of climate experts agree on human-caused global warming” (2) It looks compelling, but not everyone agrees. “..[t]he claim of “scientific consensus” on the causes and consequences of climate change is without merit”, object the authors Craig D. Idso et al., in a recent book publication by The Heartland Institute (3) Is one claim better than the other. No, because the problem is not “scientific consent”, but the facts used for consideration.
That applies to both sides, as both are too much fixed on atmospheric matters. Idso et al., cite Prof Judith Curry (p.37) with the notion: “None of the most consequential scientific uncertainties are going to be resolved any time soon”. What is not said in the first place, that water is the principle issue concerning climate. Only about 10 percent of the water evaporated from the oceans is transported over land and falls as precipitation. Once evaporated, a water molecule spends about 10 days in the air. That means a replace of about 50 times per year. The volume of water in the atmosphere at any one time is about 12,900 cubic kilometers (km3), which is about 0.001 percent of the total Earth’s water volume (Volume of the Baltic Sea 21,700 km3).
The oceans are not only the supplier of aerial vapor, but the driver of evaporation as well. Only a tiny amount of warm water ‘swims’ on a huge water body with a mean temperature of about 4 °Celsius, and an average depth of nearly 3’700 meters. Science is so far away from understanding enough details about ocean processes, how they respond to human activities at sea, and how they are going to shape our future climate, that the discussion on ‘consensus’ looks silly.
x) Mission: Deindustrialize Civilization
xx) Goal: Drive industrial corporations into Bankruptcy
xxx) Strategy: Cut off the Supply of Cheap, Reliable Energy
Tactics:
–Raise the price of fossil fuels
–Force the power grid to use expensive, unreliable renewables
–emonize Nuclear energy
–Spread fear of extraction technologies such as fracking
–Increase regulatory costs on energy production
–Scare investors away from carbon energy companies
–Stop pipelines because they are too safe and efficient
–Force all companies to account for carbon usage and risk
Radical environmentalism is playing the endgame while others are sleeping, or discussing the holes in the science. It is the belief in Climate Change and the activists executing their game plan. Make no mistake: they are well-funded, well-organized and mean business.
Former executive secretary of the UN Framework Convention on Climate Change Christiana Figueres put it in the bluntest terms: “We are setting ourselves the task of intentionally to change [sic] the economic development model that has been reigning for at least 150 years” – the free enterprise capitalist system. “The next world climate summit is actually an economic summit, during which the distribution of the world’s resources will be negotiated,” her UN climate crisis cohort Otmar Edendorfer added. “We will redistribute de facto the world’s wealth by climate policy.” *) Racketeer Influenced and Corrupt Organizations (RICO) Act
Read the recent post (13 March 2016) – upper lines added 29 March A need to identify „Climate Criminals“? For Skeptics: YES!
Skeptics should wake-up soon on identifying explicit ‘climate criminals’, starting with the First Climate Criminal – Adolf Hitler (HERE1). If not they are likely to be in focus themselves soon. Only few days ago U.S. Attorney General Loretta Lynch acknowledged that there have been discussions within the Department of Justice about possibly pursuing civil action against so-called climate change deniers….. and have referred it to the FBI to consider whether or not it meets the criteria for which we could take action on”. (see CNSNews/09 March 2016).
Climate skeptics should be alerted- The prospect is awful and dangerous.
The need to identify Hitler as the first climate criminal is simple says 1ocean-1climate. “Had Adolf Hitler been identified as the “First Climate Criminal “ many decades ago James Hansen would not have had a chance to testify to US Congress on 23 June 1988 that CO2-global-warming was underway, respectively he would been required to explain primarily how” (HERE2), “After many decades of global warming the first eight weeks in 1940 turned the wheel back to the Little Ice Age. Suddenly the winter in Europe was the coldest since the early 19th Century (HERE3)”. HERE1
Without clear evidence, that neither the extreme war winters (1940-1942) nor the global cooling (1940-1970) were in any way war related, the member of Congress would not have taken James Hansen’s claim serious (HERE2).
Unfortunately no one cared. Hansen succeeded until now. To stop him and other, it is not too late to turn the wheel around, by nominating Adolf Hitler as the first climate criminal and demonstrating, that only few months naval war were needed to ‘change climate’. That is evidence on anthropogenic impact on ‘climate change’ pure.
EXTRACT: Unprecedented Coalition Vows To Defend Climate Change Progress Made Under President Obama And To Push The Next President For Even More Aggressive Action; NEW YORK – Attorney General Eric T. Schneiderman today joined Attorneys General from across the nation to announce an unprecedented coalition of top law enforcement officials committed to aggressively protecting and building upon the recent progress the United States has made in combatting climate change.
A guest essay by Rick Wallace (R.W.) at WUWT (2016/03/10) assumes that “in real science any state of agreement is labile at best – and establishing a consensus is about the last thing on peoples’ minds”, which he base on study evolutionary biology. He thereon explains “that under these conditions, as often as not, a leading idea is a target to take aim at rather than a flag to rally ‘round.” From this perspective Rick Wallace concludes: “Obviously, this cast of mind is utterly different from what we find in the AGW arena. Which in itself is compelling evidence that the motivations are different in normal science and in (C)AGW.”
What lacks all this noble consideration is that R.W. focuses on the question of how to define what a species is, but when it comes to (C)AGW-movement a need for reasonable definitions is not raised. According R.W. it seems possible to define ‘species’, “as a reproductively isolated population, …..at least for organisms that reproduce sexually”. Unfortunately atmospheric science cannot rely on a comparable picture.
The problem in the field of “AGW controversy” is the lack of clear definitions, and the reckless mix-up of different aspects. For example: A temperature rise is not necessarily results in global warming (GW), and global warming (GW) is not necessarily related to anthropogenic global warming (AGW). The existence and cause of climate change has not necessarily something to do any increase or decrease in instrumental temperature records. The entire field lacks of clear definitions, starting with “weather” (HERE). Even though Rick Wallace essay is far too brief in this respect, it is worth reading:
“What is perhaps most fascinating about modern spectacles like the AGW movement (and here I’m thinking in particular of the Moscow show trials of the 1930s) is that the truth is always right there in front of everyone – and it is always apparent to those who can see. For such people, and this is true of most (but probably not all) AGW skeptics, the fact that some sort of charade is in progress is obvious, even if one does not characterize it in those terms. …..cont//”.
Modest means modest! Modest with regard to the sun means only a third place or less in CLIMATE CHANGE matters! Skeptics like to challenge main-stream science on the influence of the sun, HERE & HERE referring to “….spectral analysis […over the last ~ 9400 years] identifies a number of distinct periodicities/cycles such as 88 yr, 104 yr, 150 yr, 208 yr, 506 yr, 1000 yr, and 2200 yr…”. That is hardly to dispute, but still wrong with regard to the claim that “the sun has always had an important influence upon climate change”. The sun’s influence is ocean controlled: Variation in solar activity is reflected in cycles. But temporary temperature variations, have little to do with “climate change”, as e.g. “solar activity appears to have remained relatively stable since the 1700s”, assumes a recent investigation. On short term volcanos, on long term oceans change climate, but claiming that there are also “other natural climate drivers” is nonsense. It’s is all physics. There is no evidence that varying sun-ray has ever caused a significant and abrupt climatic change during several hundred-thousand years. REF-1 , REF-2
The Intergovernmental Panel on Climate Change (2007 IPCC Report) determine: “Water vapor is the most abundant and important greenhouse gas in the atmosphere. However, human activities have only a small direct influence on the amount of atmospheric water vapor.”
IPCC is ignorant and wrong on the influence of human. Since industrialization human activities churn and turn the sea surface layer down to a dozen and more meters (Fig.1). Several hundred thousand ship propellers, and million other activities exchange warmer with colder water, or vice vers, and modify the salinity structure. That is the gate by which the amount of vapor is generated.
These ocean uses affect the part of the ocean that is the major weather maker up to several weeks if not many months. The state of the upper 50 to 200 meters sea surface layer govern climate up to several years. The weather making mechanism is water vapor, and that is controlled by the state of the oceans. In comparison CO2 is just 0.04% of the total atmospheric gases (Fig.2). Whether it has a significant role depends also foremost on the conditions of the sea and its generating impact on vapor. IPCC’s ignorance disguise politics and the general public from addressing the climate change issue properly, while the skeptic community fails to challenge IPCC in this respect, as can be seen in a post at WUWT. The link concludes:
However, as Aldous Huxley said, “Facts do not cease to exist because they are ignored.”
Europe is warm (Fig1). Atlantic air flows smoothly East (discussed HERE), setting the “Siberian Express” in motion, pushing Artic air to NorthEast of the U.S. (Fig.2) That had been already the case last year (MORE) and now again this year (Fig. 3, 4):
Bitter Temperatures to Put Northeast Under Deep Freeze on Valentine’s Day(nbcnews – Feb.14/2016)
Bitter temperatures flirted with record lows on Sunday as “life-threatening” conditions put millions across the country in a deep freeze for Valentine’s Day. More than 38 million people from the Plains into the Midwest and East Coast were under winter-storm warnings or advisories
overnight, according to The Weather Channel. The coldest air mass of the winter brought the thermometer down to minus 6 degrees overnight in Minneapolis, while New Yorkers were urged to take “extreme precautions” against wind chill.
NYDAILYNEWS 02/15/2016: While New York City had its coldest start to Valentine’s Day in 100 years on Sunday, it would seem balmy compared with the wicked wind chill at upstate Whiteface Mountain. As temperatures dropped across the Northeast from the blast of a polar vortex, the wind chill at Whiteface, near Lake Placid, made it feel like a body- and mind-numbing minus 114 degrees (-81° C) late Saturday and into Sunday. Central Park could only muster a minus 1 degree.
Most surprisingly, Europe winter 1939/40 was the coldest for 100 years.
Unfortunately, back in summer 1939 there was no voice that warned Adolf Hitler and his consorts that a major war in general, and a naval warfare in particular, would bear a high risk of dangerous interfering with weather and atmospheric conditions, with unknown consequences.
In addition, no one mentioned how foolish it would be to start with naval war activities in northern European waters in early autumn. It would release the heat stored in the North Sea and Baltic earlier than in other years. This heat is an essential contributor to moderate winters in Europe. No, Reichskanzler Adolf Hitler and the High Command of the Wehrmacht had no idea of the risks, neither did their professional advisers. Meteorology failed then and over all decades ever since. Meteorology is still unable to explain what happened seven decades ago, and the few who did, presents unproven claims, as e.g. Professor Stefan Brönnimann assuming a correlation to an El Nino event. Current El Nino winter 2015/16 proves: it as nonsense. MORE Adolf Hitler’s personal responsibility, for weather and climate modification in winter 1939/40 and beyond, was never raised. That is irresponsible and a great failure of Meteorology and Climatology.
When will climate science be able to distinguish clearly between a global-average manifestation of El Niño-driven global weather effects, and an explanation of global average warming associated with El Niño? Concerning the latter aspect the World Meteorology Organization seems not able and willing to do the simplest considerations (Hottest Year). The feature is about a temporary warmer than normal SSTs across the central and eastern equatorial Pacific (ENSO), which looks like one water bubble or pool. Compared to ocean dimension it is merely “a drop in the sea”, and only a tiny fraction warmer than usual, namely about 0,5 to 3°C, with a little dip down to a depth of 100 meters (max 150m), whereas the mean Pacific depth is 4,280 m. Any rough calculation shows that there is not much El Niño can offer to heat the world and contribute to global warming. The water volume is not more than about 0,06% of the Pacific volume, and the ENSO area with higher than +3°C of average may possibly account for about 0,10% (Further details here). All oceans and seas contribute permanently heat to the atmosphere. El Nino is negligible in this respect. WMO should undertake more competent considerations, and talklessemptystuff.
Only by consensus among scientists 2015 is the hottest. Whether that is the case we do not know, as temperature records have been adjusted, adjusted, and adjusted over several decades. For 2015 NOAA presents a wonderful image, presumably more art than science, with a tiny cold hole between Iceland and Canada. The ‘glowing globe with a blue eye’ is based on global average temperature difference to the period of 1951 to 1980. That is gross negligent if not scam. The 1930s ended with almost as high temperatures as during the last decade with the years 1934, 1931, 1938, 1939 in the top league of hottest years since the end of the Little Ice Age about 1850. In late 1939 World War II commenced. Four month later the winter in Europe was the coldest for 100 years (more HERE and HERE) and subsequently global temperature broke down for decades, recovering only in the 1980s. What a disaster, if science has one day to admit that it was WWII.
Enjoy the NOAA image as art not more.
According World Meteorology Organization: “The global average surface temperature in 2015 broke all previous records….An exceptionally strong El Niño and global warming caused by greenhouse gases joined forces with dramatic effect on the climate system in 2015,” said WMO Secretary-General Petteri Taalas. In a previous post is assumed that claiming any warming from El Niño is gross nonsense, as the ‘warm water pool’ causing El Niño is too small for any significant global warming impact.
While El Niño goes strong in the Pacific, storm Henry reach Europe today, Fig. 1 & 2 , which could be an interesting case to study, whether this goes together. But not for met-services preferring to make forecast in the distant future.
OGC ascertained immediately that already the first sentence of the report is faulty. That is the crux of climate research.
REF: Met-Office: Storm Henry (Jan.30);
Monday 1 February 2016 (dailyrecord.co.uk ) Scotland battening down the hatches once again as gale force winds and heavy rain set to batter the country .
Monday 1 February 2016 (The Guardian) Gusts of 70mph-80mph expected across Scotland as bad weather also forecast for Northern Ireland, northern England and parts of Wales
Undersea volcanic eruption has caused a Snowball Earth long ago. Recent papers (HERE, HERE) and blogs WUWT, CLIMATE-ETC, ICEAGENOW showed interest concerning the impact on ocean warming, CO2 increase, and climate change. The problem is different: It could trigger a new ice age within a short period of time. The ocean is too big to reflect pronounced on a bit heat input, but may alter oceanic currents. Major changes in the global flow system would affect the sea surface. Overall ocean temperature is about 4° Celsius. The warm sea surface with more than 10°C is a very thin layer north and south of the Equator. Cooling the upper surface layer down by a few degrees Celsius could be sufficient to trigger new ice age. Mankind may have only a few months to lament about the good time of “global warming”, as the chance to alter the trend is nil, and a Snowball Earth would end further commenting pretty soon.
His main point from the abstract: The marine environment of North Sea and Baltic is one of the most heavily strained by numerous human activities. Simultaneously water and air temperatures increase more than elsewhere in Europe and globally, which cannot be explained with “global warming”. Excerpts: Since mankind, during the course of a year, agitates the water column of North Sea and Baltic by stirring, more warmth is taken to deeper water in the summer season and rises to the surface from lower layers in the winter period, where heat is exchanged with the air until sea icing is observed. This is a process that can be seen from the beginning of September until the end of March. Summary The facts are conclusive. “Global Climate Change” cannot cause a special rise in temperatures in Northern Europe, neither in the North Sea nor the Baltic or beyond. Any use of the oceans by mankind has an influence on thermo-haline structures within the water column from a few cm to 10m and more. Noticeable warmer winters in Europe are the logical consequence.
North Americans should not think themselves unaffected by all this. Consider this graphic of the Siberian Express:
The more the Atlantic weather governs the situation beyond the Ural the further Polar and Siberian cold will be pushed eastwards, called ‘Siberian Express’(Fig). This was felt in Alaska, Canada and Eastern U.S. Many days were extremely cold with deviations from the mean of 20°C and beyond. “ More information is here: http://www.ocean-climate-law.com/12/arch/12.html
The current 2015–16 El Niño is one of the three strongest ever recorded. For a number of months El Niño is blamed for unusual weather, which is widely acknowledged that certain effects can be linked to a strong El Niño. While the event causes weather ‘moderation’, its impact on global warming does not. A plain calculation suggests: negative.
A warmer than average water pool along the Equator must have an effect on air circulation. As soon as the usual trade-wind ceases the entire global air circulation changes. When the trade-wind cease, global air circulation adapt to the change. Unusual weather is inevitable, and different temperature levels may follow temporarily. But a general warming is most unlikely.
Attached are two graphs indicating the dimension of current El Niño. By rough calculation the warm water-pool is about 5’000 km long (West-East), 2’000 km wide (North-South), and 0,1 km deep, covering an area of 10 Million square-km, or a volume of 1 Million cubic-km. If one puts this numbers into a global perspective, namely an ocean area of 361 Million sqkm, respectively ocean volume of 1285 Million cubkm a correlation can be explained only by faith. The minimal higher temperature of the pool (<2,5°Celsius), may alter temporarily some atmospheric conditions, but is barely sufficient to warm the entire climate system. Not only El Niño releases heat to the atmosphere, but so does every square-meter of the oceans. OCEANS GOVERN CLIMATE
Only four months into World War Two (WWII) winter weather 1939/40 run amok and global air temperatures dropped for three decades until mid-1970s. After the end of 70 years copyright barrier, Hitler’s ‘Mein Kampf’ is back in print, a book full of hate, lies, and stupid conclusions, written between 1924 and 1926. He is better known as the greatest war monger of all time, but due to failure of meteorology and climate science, was never identified as the first and worst individual who caused climate change, and called a “criminal in climate change matters”. Adolf Hitler started WWII on 1st September 1939 and only four months later Europe tumbled into the coldest winter in more than 100 years. By mid-January 1940 temperatures fell to minus 40°C at many locations from Leningrad/St. Petersburg to Sofia, with an all-time cold record in Poland. For more details see January 1940 Temp-Map. The coldness continued until the end of February 1940. But science does not know.
That all happen 76 years ago. In winter 1939/40 a strong El Niño was active, in Europe extreme cold temperatures governed. This winter, the so-called “Monster Godzilla El Niño”, influences the weather worldwide, in Europe temperatures are above average (see: Fig.). Do not ask science for the reasons for these dramatic differences. Science don’t know; and seems not to have the capacity (mental, financial, and willingness). Science shows no interest to identify Adolf Hitler objectively as the greatest climate change criminal. Science is hopeless in WWII climate change matters, a matter never barred from being investigated, published and explained.
“One of Poland’s deadliest-ever cold snaps killed at least 21 people over the weekend, with temperatures falling to -18C (-0.4F), officials say”reported BBC on January, Monday, 04. . Meteorology Services underline such incompetent reporting, e.g. weather.com, instead of informing the general public that 76 years ago air temperature plugged to record lows before mid-January 1940, as reported by the New York times; 08. Jan: minus 35°C in Northern and Central Russia, and on the 11th: Romania -40°; Riga -41°; Vienna -26° Sofia; and at Siedlce in Poland minus 41° the all-time record (see map; Source). Although also a strong El Nino year, the difference between January 2016 and 1940 is tremendous, because Europe was in the fifth month of World War II, that altered the status of the reginal seas so much, that the cold snap in early January 1940 was only the beginning of more worst to come. The prospect this January is very different as indicated in the attached graphic. See for entire month January 1939 versus 2016 previous post: https://oceansgovernclimate.com/storm-frank-el-nino-insufficient-explanation/
When will it be recognized that the oceans are huge and have only an average temperature of + 4°C, able to cause very sudden drastic cooling —that could threaten the survival of civilization.
One of the most shocking scientific realizations of all time has slowly been dawning on us: an abrupt cooling could be triggered by our current global-warming trend. Europe’s climate could become more like Siberia’s, assumed William H. Calvin some time ago, warning that global warming could lead, paradoxically, to drastic cooling — a catastrophe that could threaten the survival of civilization. In his view there seems to be no way of escaping the conclusion that global climate flips occur frequently and abruptly. An abrupt cooling could happen now, and the world might not warm up again for a long time.
Calvin’s essay was published two decades ago, but a global cooling issue is poison to AGW, the anthropogenic warming thesis of mainstream climate science. Unfortunately the situation is even worst. W.H. Calvin assumes that the world could be back to ice-age temperature within a decade. It can happen much faster.
Adolf Hitler and his naval force managed to catapult Europe back to an ice-age winter in just four months, namely from September to December 1939, as indicated in the previous post and Oceans Govern Climate
Climate alarmists have run wild with predictions about the Monster El Niño active in the Pacific for several months (MORE). A corresponding situation existed in late 1939. But between the temperatures January 1940 and assumed January 2016 the difference could not be bigger. Don’t ask meteorology to explain. 76 years have passed without ever been interested in the matter.
But while it is expected that December 2015 is the hottest on record, December 1939 was the beginning of an extreme cold winter in Europe. The winter was special because it was the coldest since the end of the Little Ice Age around 1850, turning a global warming trend into a three decades lasting period of cooling, which happened after four months war, in World War II. Why caring about winter 1939/40? Why took “General Frost” reign as early as mid-December 1939? Why understanding too much of climate change and man’s impact in this matter?
Up-Date Met-Office 31 Dec: “…..the specific nature of this December’s extreme weather might be linked to the detailed structure of this El Nino, to the warmth of the north-east Pacific Ocean and to their combined effects on the atmospheric circulation………So from basic physical understanding of weather systems it is entirely plausible that climate change has exacerbated what has been a period of very wet and stormy weather arising from natural variability.” Met-Office 31 Dec. 2015: “What’s been happening to our weather?”
Sorry, the water around the UK is important for weather in the UK. Psst: Don’t tell Met-Office what is easy to see in two previous posts
The recent run of unsettled, wet weather will continue this week with Storm Frank (MetOff-29Dec15), the sixth named storm of the season arrives. December has already been a record breaking month for rainfall in some parts of the UK, with exceptional amounts of rain falling onto already saturated ground (28Dec- HERE). Wet weather will continue. Storm Frank (955 hPa) south-east of Greenland Tuesday morning is on the way (29 Dec) –Fig 1 (left)– How much of this situation is due to Northern Europe’s condition, high air pressure East of the Baltic (Fig.1), and high sea surface temperatures from Faroe Island to St. Petersburg (Fig.2 – right). No wonder that Met-Off is surprised, if not taking the North Sea and Baltic into account, and not asking why? Excessive use of the regional seas should not be ignored. HERE & HERE
Met-Office update: 30 December 2015 – Heavy rain and strong winds associated with Storm Frank have affected many parts of the UK -HERE-
Recent weeks have been warm in Europe, well above average. The North Atlantic sea surface temperatures are below average, but the ocean north of Iceland, and the North Sea and Baltic, well above. That warms Northern Europe, at a time when the influence of the sun is modest and the seas heat the region significantly. Not necessarily everyone understands it. According to the UK Met Office, the exceptional warmth in Britain and northern continental Europe is linked to the strongest El Niño ever recorded, causing unusual weather from Britain to Australia, reports The Guardian (Dec.20, 2015): “What we are experiencing is typical of an early winter El Niño effect,” said Adam Scaife, head of Met Office long- range forecasting.
What Mr Adam Scaife does not tell us, how a warm-water –section in the Pacific can warm the water
around Europe from Gibraltar to Svalbard/Spitsbergen?
Without mentioning a correlation between warm air temperature and the warm seas in Europe is of little help. Not even mentioning the sea water conditions is weak science, and not worth to be taken serious.
For the Belgian Professor of Chemistry István Marko “it is a mystery how any serious environmental organization holding the belief that man-made CO2 emissions are damaging global climate would be satisfied with such a powerless agreement, which we are now seeing as being nothing more than an illusion of a binding treaty.” Notrickszone
Prof Marko has no good word for COP21, seeing the rich countries engaged in “wishful thinking“, but are his thoughts any better? As a man of chemistry he should know more about climate affairs, and what makes work. More than two-third of weather and climate is done by water, in the air and oceans. When Marko calls COP21 as no useful or showing serious results, one wonders what he offers instead. Too little to credit his thoughts higher as he credits COP21: a “grand illusion“; a “resounding failure”. Either Prof. Marko tells us something about the “climate-water-system”, or he keeps his mouth shut.
One single winter proves that COP21 is wrong! War winter 1939/40 proves COP21 acts irresponsible.
There was an El Nino active in late 1939. Since May 2015 a ‘Monster Godzilla El Niño” is promulgated by science and the press. In Paris COP21 agreed a new climate treaty on global warming few days ago on Sunday the 13th December, without taking note of the real world.
By mid-December 1939 in Northern European waters sea icing commenced:
__From Denmark first signs of ice were reported around mid-December and they increased soon in the inner closed waters. _ Icing emerged on river Elbe on the 16th of December 1939, intensified massively before month end, and continued with extreme sea ice conditions for 90 days –throughout the regional seas- until mid-March 1940.
This year, with ‘normal activities at sea’, North Sea and Baltic are much warmer than average (Fig.1), far away to freeze. That was different seven decades ago. Naval war has churned the sea, cooling it down, sea ice established early and lasting, for which only man was to blame! Easy to find out. But COP21 remains in cloud-cuckoo land.
Since 2011 a new satellite system collects data on long-term climate change and short-term weather conditions. Once and a while it produce nice pictures, as recently, when damaging heavy rains fell on South Carolina in the southeastern United States at the beginning of October 2015. Much of that water had, by mid-October, flowed into the Atlantic. The image, a Visible Infrared Imaging Radiometer Suite (VIIRS), shows the runoff as it interacts with ocean currents on Oct. 15. Climatologists use VIIRS data to improve our understanding of global climate change (Source).
Beautiful pictures not necessarily improve understanding. The oceans are deep and the image only shows the surface layer, to which satellite data contribute at most a fraction, if any useful information about the ocean interior at all. Enjoy the picture, but remain reserved that it contributes significantly to understand oceanic influents on climate, as oceans govern climate.
Prof. H.J. Schellnhuber’s 784-page epos ‘Self-immolation’ (2015), just published in time for COP21, commencing in Paris today, is a masterpiece piece of missionary work – for doom mongers.
Peter Höppe, Head of Munich Re’s Geo Risks Research/Corporate Climate Centre: “Self-combustion’ is the book of one of the internationally most renowned climate scientist, that is written with lots of personal commitment. There is probably no other book that depicts the physical processes and political discussions about climate change as comprehensively and understandably as this one. Time and time again Hans Joachim Schellnhuber intentionally changes his perspective from an objective role as a scientist, takes side and works with his unconventional style of writing. It is a captivating book worth reading.” Really?
As early as 1978 Schellnhuber talked about a carbon dioxide problem. In 1989, environmental Bill McKibben said humanity was in danger of burning up in “a few more decades” if we didn’t overcome our “addiction” to fossil fuels. Now activist scientist Hans Joachim Schellnhuber insists we’re on track for self-immolation. He pays little attention to the seas, their extreme low mean temperatures of about +4°Celsius, and the much greater danger that the oceans one day may trigger a new ice age again – then we would be happy that the world has been warming since the end of last Little Ice Age about 1850.
We shouldn’t allow the doom mongers to missionary the world, based on insufficient knowledge of how climate ticks.
“Most of the people going to Paris will know nothing about the climatology or climate science. They will not know or want to know that the science used as the basis for the conference is a creation of corrupted people who hide behind rules created for a completely different purpose”, is the verdict of Tim Ball [at WUWT – 27 Nov. 2015].
Few decades ago the late Chair of Canada’s national Climate Program Planning Board (1992-202), F. Kenneth Hare. said this about Climatology: “You hardly heard the word professionally in the 1940s. It was a layman’s word. Climatologists were the halt and the lame. And as for the climatologists in public service, in the British service you actually, had to be medically disabled in order to get into the climatological division ! Climatology was a menial occupation that came on the pecking scale somewhat below the advertising profession.” In Bulletin American Meteorological Society , 1979, p. 1171-74.
The lesson from this is, neither understood the subject climate,
nor something learned from F. Kenneth Hare’s finding.
When did we “pathologize” weather? When did commonplace weather become abnormal? The debates over the past and future of anthropogenic climate change are of great importance (climate change is ubiquitous in history). But the news increasingly describes normal weather as a kind of plague, something to fear.
Climate alarmists have run wild with predictions about the “monster” “Godzilla” El Niño, a last throw of the dice before the COP-21 climate conference in Paris. The latest forecasts of the major climate models suggest that it will disappoint activists. All at WUWT
Is Monster Godzilla El Niño not shaping Europe’s winter? HERE
What will strongest ever El Niño, widely named ‘Godzilla’, do to Europe’s
coming winter?
Generally, El Niño could cause a jet stream configuration to allow for
cold air at times into West-Europe, says accuweather.
NOAA forecast predicts differently (Fig), temperatures well above mean.
1939 was as also an El Niño year, but Europe suffered under the coldest
winter for 100 years. Many decades have passed, but nothing explained.
Is that serious science?
We will see! Winter 2015/16 is coming for sure, and the strength of
El Niño is likely to pike in December, NOAA predicts (12.Nov.15).
Forward! Forward! Let’s proceed to the largest and probably most senseless investment ever. Big money for climate science in sight! Paris will soon host a meeting (COP21) based on the Framework Convention on Climate Change, 1992 (UNFCCC), to replace the Kyoto Protocol (1997) that commit States to reduce greenhouse gas emission, to establish a ‘Green Fond’ to assist developing countries in adaptation and mitigation practices to counter climate change. For this aim a ‘mere’ 100 Billion $ shall be raised per annum. Within a decade that sums up to 1 Trillion. For those who have no idea of what this means, they should note that the economic cost of the entire WWII have been estimated with a sum of about U.S. $ 1,600,000,000,000 (1.6 Trillion). This deal is pushed by IPCC and people who agreed on the UNFCCC, a document, which does not even say what ‘climate’ means. This approach is stunning, and utterly irresponsible. Science claims that CO2 emission is warming the world, paying too little attention that water ‘is the driver of nature’ (Leonardo da Vinci) and not able to recognize that the oceans dominate and control the climatic system. The attached image shows the proportion between C02 and water vapor, while the latter has a ratio to the oceans of 1:1000.
Spending 100 Billion p.a. in a still poorly understood mechanism is of little help for climate control, but would generate large sums for science to continue letting the public believe that they understand what they pretend are supposed to understand?
EXXON’s fault is not strongly opposing a meaningless language with regard what ‘climate’ is, but accepting that. WMO/IPCC regard that
“ Climate as the statistical description in terms of the mean and variability of relevant quantities over a period of time ranging from months to thousands or millions of years.” (IPCC, AR5, 2013, Glossary, p. 1450) What are “relevant qualities …from months to millions of years”.
The sea is by far the biggest generator of vapor
How can science work and communicate with the general public, politics, and skeptics with such nonsense?
According the Glossary of the American Meteorological Society (AMS), the “weather” depend on what you are looking for:
____The “present weather” table consists of 100 possible conditions,
____the “past weather” comprise 10 aspects, while
____”layman weather”, covers merely temperature, humidity, precipitation, cloudiness, visibility, and wind.
Even if the AMS-Glossary is silent on “future weather”, the nonsense gets a face. Who is making the selection? Who decides over the period of time, and the length of a data series.
It should not be such a surprise that discussing ‘climate’ has been so unproductive over the last 30 years. EXXON is acting globally, has top lawyers, scientists, engineers and enough money to require and support a clear and indubitable terminology in an area of paramount importance.
Climate variability in the North Atlantic is atmosphere driven a new study claims. [ScienceDaily, 15 October 2015] explaining: that the pattern of the AMO*) can be accounted for by atmospheric circulation alone, without any role for the ocean circulation.
Is that serious? The AMO pattern is based on statistical analyses of observational and proxy climate data. If the study compares climate models that include ocean circulation with climate models that have no ocean circulation, and concludes that ocean circulation may not play as prominent a role as previously thought, the researcher ignore the difference in dimension involved. The correlation between sea and air is about 1:1000. Small difference (howsoever explained) not rectify to question that the North Atlantic is the principle driver of regional temperatures and weather.
*) AMO – Atlantic Multi-decadal Oscillation. ScienceDaily : University of Miami Rosenstiel School of Marine & Atmospheric Science. “New study questions long-held theories of climate variability in the North Atlantic: Atmosphere appears to drive decades-long climate variations.” ScienceDaily, 15 October 2015. www.sciencedaily.com/releases/2015/10/151015144804.htm
Frequently heard; there is confusion between weather and climate. For real? Is it not due to poor definitions?
Definitions: IPCC, AR5, 2013, Glossary, p. 1450
Talking about weather foremost requires selecting on what weather pattern one needs or wants to talk about. The British know it, others as well. For ordinary men it may be entertaining, but in science it is a lack in seriousness and competence. Weather components or explanations can go in many hundred items, for which science offers commonly only a very general explanation (NASA):
“Weather is the way the atmosphere behaves.”
What an enlightening statement! That is definitely not a serious definition, and for any scientific work absolute useless. Nevertheless science does not hesitate to say: “Climate in a narrow sense is usually defined as the “average weather” or more rigorously, by statistical description.” (See image)
Now many ‘weather situations’ and other events can be linked to climate and climate change, and open a wide field for confusion, nonsense talking, wrong research trends, and costly misplaced political investments (1).
One day the world will have to pay a heavy price for the lack of proper academic terminology, as it prevents to come up with definitions that put the oceans first:
oceansgovernclimate.
(1) The 2015 United Nations Climate Change Conference, will be held in Paris from November 30 to December 11, aiming to establish funds rising to USD 100 billion per year by 2020.
Weather will get interesting over the next months. Speculations are high. A rapidly strengthening El Niño event will likely peak later this fall as one of the strongest El Niño event ever observed (24/09).
23 September 2015 – Global Sea Surface Temperature Anomaly
There is an approximately 95% chance that El Niño will continue through Northern Hemisphere winter 2015-16, gradually weakening through spring 2016 (NOAA). What does this mean for the upcoming winter season? That is the big question!
For Europe the risk of a colder is currently considered small, predicted UK-MetOffice recently. The GUARDIAN offers more options;
• 10 September: El Niño expected to hit US hard, but not enough to ease California drought. Climate officials warn winter’s weather pattern likely to be one of the strongest as effects are likely to be felt from December to March • 17 September : The world has experienced record-breaking warmth every month so far this year, and Noaa scientists say global warming and El Niño are the cause • 21 September: El Niño: a global weather event that may save California — and destroy the tropics.
The SST-Anomaly map indicates to two further areas of interest, with too warm SST in the Eastern North Pacific , and too cold SST in the North Atlantic. What is at stake? How will the winter 2015/16 be in North America, in Europe, and Siberia?
Water temperature profile in southern Baltic Sea over a depth of 43 m at several levels
Science has not yet explained why Norther Europe warms more than the rest of the world (REF.) Any impact of ocean use has not crossed their mind. Today further 80 offshore wind turbines north of Rügen start-up, at a location which is between 23 to 40m deep. Over the seasons the temperature difference between top and bottom can reach more than 12°C and differ between various depths level and throughout the season. As the water masses of the Baltic is in move permanently, inevitable any kind of platform forms a considerable obstacle, forcing the “natural current” to change course. During summer that will force more heat in, and in winter more heat out. Regional air temperature is likely to increase. This is a very simple process to recognize. Too difficult for science to understand and investigate?
Skeptics are doing what scientists are supposed to do, that is disproving the AGW hypothesis, reminded Tim Ball in a recent WUWT comment [19. September.], when some IPCC members required to launch criminal charges against “climate deniers”. Of course such talking is ridiculous and irresponsible. But can Tim Ball require more serious behavior? Are skeptics so much better? Not when it comes to clear scientific terminology, as they use the same nonsense climate terms as the promoters of ‘official’ climate. Tim Ball is no exception (see here). Neither CLIMATE nor WEATHER is defined in a manner that servers discussion and understanding our water planet. That supports a “Climate Science turned Monster”, and skeptics inability to stop this trend. They could by requiring precise and clear terminology, which meet academic standards.
“Although the solar effect on the North Atlantic Oscillation explains only a few percent of the total variance, the close relationship between solar activity and phase North Atlantic Oscillation is an important indicator to improve the predictability of climate variability” say GEOMAR (press-release 15. Sept. 2015)
“Rising global temperatures since the industrial revolution cannot be attributed to increased solar activity”, reports Phys.org. (August 7, 2015); by concluding “The apparent upward trend of solar activity between the 18th century and the late 20th century has now been identified as a major calibration error in the Group Sunspot Number. Now that this error has been corrected, solar activity appears to have remained relatively stable since the 1700s.”
It is time to put the sun in second or third position. There is no evidence that varying sun-ray has ever caused a significant and abrupt climatic change in many million years.
Big Changes Underway in the Climate System? MetOff-Sept.2015
Did UK-Met get already in a 21 pages long analysis (September 2015) the first sentence wrong, by saying:
“The Earth’s global average surface climate is primarily determined by the exchange of energy between the atmosphere, the oceans and space”.
One may say that without being wrong, but it disguises the real dimensions over longer periods of time (climate), because the bulk of energy exchange is between oceans and space. Average surface temperatures depend highly on ocean heat storage and heat release.
The analysis confirm it by attributing any possible changes to the current status of El Niño, PDO, and AMO, not hesitating to conclude the report with a meaningless statement: “ Further long-term global warming is expected over the coming decades but variations of climate worldwide from year to year or decade to decade will always depend on the subsequent variations in the patterns of climate variability described in this report.”
MetOff. express concern (28.Aug.15; HERE-1): No-one can deny that we have had a pretty
disappointing summer with a lot of unsettled weather and only a few warm spells,
especially through July and August.
How the sea keeps Great Britain cold
Meanwhile DAILYMAIL predicts (HERE-2): A cold snap will begin on Sunday in Scotland and is expected to spread southwards, bringing snowfall to parts of England and Wales by Wednesday. Worst! Birmingham hit by ‘snow’ in September in unseasonal deluge, reported BirminghammMail on 02nd Sept (HERE-3).
The reason is simple. The North Atlantic water temperature is significantly below average. It affected UK summer weather and will dampen global temperature level. The sea shows strength in weather making, but MetOff shows little interest. Instead they “look beyond our shores” (read about it HERE-1)
1__http://blog.metoffice.gov.uk/2015/08/28/so-what-happened-to-our-summer/
2__http://www.dailymail.co.uk/news/article-206474/Big-freeze-way
3__http://www.birminghammail.co.uk/news/midlands-news/birmingham-hit-snow-september-unseasonal-9973619
h/t Paul: NCEP/NCAR reanalysis shows frigid summer conditions across the north. – See more at: http://notrickszone.com/#sthash.IruSgWMm.zvjivgR0.dpuf
“The apparent upward trend of solar activity between the 18th century and the late 20th century has now been identified as a major calibration error in the Group Sunspot Number. Now that this error has been corrected, solar activity appears to have remained relatively stable since the 1700s.”
It is time to put the sun in second or third position. There is no evidence that varying sun-ray has ever caused a significant and abrupt climatic change in many million years. Changing sun-ray will influence sea surface temperature accordingly, which show up in statistics, but that does not cause climatic changes. The control button is in the hand of the driver of climate, the ocean. The sun is insignificant in the global warming 1920-1940, and the global cooling 1940-1970, the oceans not.
Anthony Watts’ recent post (30. July 2015) cites a study by Andrey Savtchenko et al. (NASA) indicating
“that El Niño contributes only six percent to California’s precipitation variability and is one factor among other, more random effects that influence how much rainfall the state receives. While it’s more likely El Niño increases precipitation in California, it’s still possible it will have no, or even a drying, effect.”
What a helpless science. Why? They have not investigated what they should have done a long time ago.
Since summer 1939 a strong El Niño was active off South America’s coast. Few weeks later there was war in Mongolia and Europe. California experienced an eight days heat wave, since about 16th September followed by a severe tropical storm New York Times, 25th September) and record rain. It was the heaviest September rain in Los Angeles’ weather history and it broke the worst heat wave in Weather Bureau records, as measured by intensity and duration. It lasted for eight days. (NYT, 26 September). While Western Europe experienced an extreme rainy autumn, the USA ‘fell dry’ after receiving only a small percentage of normal precipitation: in October 78%, in November 44% and in December 71%. According to US Weather Bureau the fall season was extremely dry over large areas. (NYT, 07 January.1940). [for more see page 34ff at: http://www.1ocean-1climate.com/book.pdf ]
If NASA experts would have paid more attention on the extremes mentioned and shown in the US maps for two months in 1939, they may have been able to offer better forecasts concerning El Niño and its impact elsewhere.
The other day Lomonosov Moscow State University got worldwide attention. By press release (16.July 2015) a new study was presented: “New Ice Age may begin by 2030”, assuming that: “The arrival of intense cold similar to the one raged during the “Little Ice Age”, which froze the world during the XVII century and in the beginning of the XVIII century, is expected in the years 2030–2040. “
The study claims it will be the sun. A new reduction of the solar activity will lead to reduction of the solar irradiance. Indeed, solar activity affects the climate. Without the sun ‘climate’ would not exist. But is that enough to rectify the assumption? Certainly not, sun radiation varies over periods and cycles, which will be reflected in temperatures variation, but never caused a significant climatic change event. For that water is needed, and earth has plenty of it. Not surprisingly, the article not even mentions the oceans. The oceans absorb, store, and release heat, which makes them the driver of climate. Their biggest potential to cause climate changes is the low temperature the entire water mass has, just about plus four degrees Celsius.
Competence in climate research does not go without the oceans. The LMSU study ignores the driver of the climate completely, while admitting: “However, only the time will show soon enough (within the next 5-15 years) if this will happen.” That is not very impressive.
Offshore wind turbines “consume wind”, a force which is no longer available in the West Wind Drift to flow smoothly eastwards, explained a recent post (Link 1) with reference to work by Mark Z. Jacobson. Chien Wang and Ronald G Prinn (2011) found that offshore wind turbine installations cause a surface cooling over the installed offshore regions whereby this cooling is due principally to the enhanced latent heat flux from the sea surface to lower atmosphere, driven by an increase in turbulent mixing caused by the wind turbines which was not entirely offset by the concurrent reduction of mean wind kinetic energy (Link 2).
What the two papers ignore is the impact offshore installation cause due to immense obstacles between sea surface and the sea floor. They permanently change to flow of sea current and tides, altering the temperature and salinity structure on all levels. That is presumably much more relevant as what the papers discuss.
New field observations of actual wind turbine arrays are definitely required to provide ultimate validation of potential climatic impacts.
Actually Tim Ball does not say what climate is, he only refers to climatology and climate science. Is that sufficient to understand, respectively enshrines a definition for the term “climate”. In a recent post at WUWT (29:June2015)that is what he said:
Climatology is the study of weather patterns of a place or region, or the change of weather patterns over time. Climate science is the study of one component piece of climatology. The analogy I’ve used for decades is that climatology is a puzzle of thousands of pieces; climate science is one piece of the puzzle. A practical approach to assembling the puzzle is to classify pieces into groups.
The problem is obvious, what is a “weather pattern”? Tim Ball is silent on it. Is it meaningless? That depends, for laymen not, because it is what they experience every day, for academic work it is utterly nonsense. Why?
Weather is the state of the atmosphere. Weather, seen from an anthropological perspective, is something all humans in the world constantly experience through their senses, at least while being outside. There are socially and scientifically constructed understandings of what weather is, what makes it change, the effect it has on humans in different situations, etc. Therefore, weather is something people often communicate about. (wikipedia.org/wiki/Weather)
Pattern is something that happens in a regular and repeated way. (merriam-webster dictionary)
Indeed, also weather – as a state of the atmosphere- is a laymen term people often communicate about. That is a very different sphere form scientific research and clear and correct scientific communication. Recently Tim Ball mentioned (25. Feb. 2014– HERE) that Theophrastus (around 300 BC), a student of Aristotle’s, wrote a book setting out the first rules for weather forecasting recording over 200 empirical indicator. .Although Tim Ball admitted that “we haven’t come very far since. Indeed, I would argue we have regressed“, he use a climate terminology, which is similar superficial as used by main stream weather science.
The West Wind Drift supported by warm North Atlantic and Norwegian Current keep North Europe’s winter mild. How many offshore wind turbines are needed to decrease the flow of this warm air eastwards, which usually keep Siberian temperatures at bay from reaching West Europe? Today already more than 1200 turbines are grounded in a water depth down to 30 meters and more. The turbines “consume wind”, a force which is no longer available in the West Wind Drift to flow smoothly eastwards. Will it one day show an impact on the weather and air temperatures?
Computer simulations by Professor Mark Z. Jacobson have shown that offshore wind farms with thousands of wind turbines could have sapped the power of three real-life hurricanes that may diminish peak near-surface hurricane wind speeds by 25–41 m s−1 (56–92 mph) and storm surge by 6–79%. That is impressive, but for a reduced Hurricane Katrina’s wind speeds by 50 percent by the time it reach land a protective wall of 70,000 offshore wind turbines built 60 miles offshore from New Orleans would be needed.
On one hand the North Sea is far away from such figures, on the other hand the West Wind Drift across Northern Europe is an important factor in the Northern Hemisphere weather system where presumably much less turbines may have a serious impact. It seems neither any regulatory agency nor science has shown any interest in the matter until now.
A UK Policy paper (2012/2015),: “2010 to 2015 government policy: climate change international action”, assert in Annex 5 to provide a definition on “climate change” (Link and full text below), but instead speak about statistics related to components of the atmosphere, oceans, cryosphere, and land surface. Actually they say: “Climate is a statistical characteristic“. Such an explanation is meaningless, at least superficial and thoughtlessly. One cannot change something without saying what this something is. This is the first fault, because a statistic is a statistic, and informative only for one individual item of investigation.
Maybe the UK Policy paper refers unsaid to the widely used saying (including the International Meteorological Organization – IMO) that “climate is average weather”. Although this layman expression is for scientific research and thruthworthy communication hopelessly out of place, the UK Policy paper demonstrates that it does not care at all, respectively that they have little understanding of the issue, when they include into “climate change” also:
statistical characteristics of the oceans (such as heat content or sea level rise),
statistical characteristics of the cryosphere (such as extent of sea ice or length of glaciers) or
statistical characteristics of the land surface (such as changes in vegetation type)
Such an all-embracing definition explains noting, and may only serve to lie in the own pocket, or misguide the general public. A clear and meaningful language is a minimum science and politics should use.
UK Policy paper (2012/2015) (Annex 5):
QUOTE: “A formal definition of climate change is:
“A change in the statistical characteristics of the atmosphere (such as temperature, rainfall, pressure, or winds), oceans (such as heat content or sea level rise), cryosphere (such as extent of sea ice or length of glaciers) or land surface (such as changes in vegetation type) typically sustained over several decades or longer. A change in climate may be due to natural or anthropogenic (i.e. due to human activity) factors, or a combination of both.”
Human-induced climate change is the current, past and future change in climate being driven by greenhouse gas emissions and other human activities, such as deforestation.
When Government talks about “climate change policy”, or action to “tackle climate change”, we are talking about climate change mitigation and adaptation. Adaptation is taking steps to minimise exposure to damaging impacts of climate change, and to build resilience and reduce vulnerability to a changing climate. Mitigation is taking steps to minimise the scale of global temperature rise by reducing emissions of greenhouse gases and taking other steps, such as planting more forests.” UNQUOTE
In the last post Willis Eschenbach was cited: “we can say nothing about whether the ocean might be warming, cooling, or standing still.” We doubt that it will be possible soon, as the “oceans have stripes”.
A paper by Ethan Gutmann (2008)HERE explains:
“These stripes are not visible without looking very closely, but they are visible through their effect on currents, temperatures, and sea surface heights. They were first spotted in a careful analysis of the Mean Dynamic Ocean Topography (MDOT) dataset, but had to be confirmed by looking directly at ocean buoy and vertical temperature profile data”. Further details (selection):
The stripes have velocities around 1-1.5cm/s,
Most changes in sea surface height, velocity, and temperature occur over thousands of kilometers.
These stripes are interesting for a number of other reasons. For one thing, they persist to at least 700 meters deep…
the velocity within the stripes does not always follow the orientation of the stripes.
That is a good question! Willis Eschenbach raised it at WUWT recently: HERE A convincing answer would be invaluable. For years a lot of opinions swirl around. Prof. R. Pielke Sr (2008) regards „monitoring of global average ocean heat content as the appropriate metric to assess global warming.” HERE The IPCC-2007 assumes a warming of the upper sea level 0 to 700 meters, HERE, claiming that “Approximately 7.9 million temperature profiles were used”. Is that a lot? Definitely not, as only three cubic-meters of water have the same heat capacity as an air-column of 1x1x10’000meter. The number of data required would go into billions. The Ocean is huge, deep and cold.
An image from the Atlantic may serve as illustration. It seems Willis Eschenbach recognizes rightly when he concludes his essay:
“we can say nothing about whether the ocean
might be warming, cooling, or standing still.”
The name “oceansgovernclimate” is program. Measures to protect climate without profound information and understanding of the oceans are costly, insufficient, and delay action to prevent anthropogenic “ocean change” that probably cause climate change. Since long we support the fascinating theory on the impact of naval war on climate, as outlined in the “Booklet on Naval War changes Climate”. The two World Wars demonstrate conclusively how easy human activities induce alteration in the sea-structure that leads to climatic changes. ‘Human activities’ cover everything, from shipping, fishing, leisure boats, and off-shore platforms. In so far the two major naval wars served as ‘large field experiments’, as summarized in the conclusion of the Booklet “Can WWII go by unnoticed?”, from which the following excerpts (p. 94f, PDF) are taken:
QUOTE. “The aim of the book was to leave no doubt that the ocean determined where the climate was heading to. In this scenario, CO2 played only a minor role. CO2 was definitely neither the source of the “Big Warming Bang” (in 1918, far in the North of the North Atlantic), nor of the global cooling (from 1939 until the 1980’s).
Oceans and seas are very complex, which are not well-understood not even today. But war at sea during two major world wars was a tremendous force that has left its trace on the oceans. Two climate changes during the last century prove our thesis. Winter temperature had risen in Spitsbergen with 8ºC (1918–1939). The whole Europe got warmer every year. The German Chancellor Adolph Hitler started the war in 1939 and immediately North Europe was dragged back into the Little Ice Age, which implied climatic conditions not experienced for over 100 years. Two arctic war winters followed in the region with extreme naval activities until the war at sea went global, in 1942. And what followed immediately after that? There were four decades of global cooling, affecting particularly the Northern Hemisphere, because here naval war had the most devastating effects and left a definite fingerprint in the downturn of global temperatures. Even though our book section on naval warfare between 1942 and 1945 is short, the connection between naval forces and global cooling is overwhelmingly convincing.
Winter temperatures of more than 5ºC below average are totally out of tune. Weather statistics cried for attention, but nothing happened in this respect over more than six decades. Until now, only one of the most ruthless WWII warmongers, the German Vice-Chancellor Hermann Goering, commented the arctic winter of 1939/40 by saying that a higher power has “sent” the harsh winter conditions. It is time to prove him wrong and to blame him, Hitler and the Nazis for having caused the arctic war winters and the global cooling………………
So far, the statements seem to contradict each other. But in a wider sense, they are pretty logical. Someone who claims to be able to explain current global warming must implicitly be able to explain a pronounced global cooling which affected the climate only half a century ago. Ignoring the event for more than six decades is even more bizarre than relating phenomena to a ‘higher power’.
If this investigation succeeds in proving that two major wars changed the course of the climate twice in the last century, it will also prove that shipping, fishing, off-shore drilling, and other ocean uses had constantly contributed to the global warming since the start of industrialization, more than 150 years ago.
A new chapter on the climate change issue could be now opened, giving more attention to oceanic phenomena under the influence of the potential of the “1982 United Nations Convention on the Law of the Sea”. All research would lead to a better understanding and protection of the stability of our short-term weather and long-term global climate.” UNQUOTE
Material available at: http://www.1ocean-1climate.com/.
„Please find attached the first WorldPress contribution,suggesting that the four images are enlargeable.„
powershell mod, Powershell certification, Powershell training online on “Climate” – a creation of corrupted people – COP21: “You guys really provide the best answer which I actually seek for…. Thanks! Your information is really beneficial…” Jul 30, 21:23
Online Hotels Booking on Are Oceans Warming?: “Marvelous post. You made some really good points discuss here. I am glad that you simply shared this very useful…” Dec 31, 08:20
Ron Clutz on “Hothouse Earth” status assessed – By ignorant climatologists!: “Arnd, I just noticed this article: https://www.prnewswire.com/news-releases/air-pollution-not-greenhouse-gases-is-the-main-cause-of-global-warming-300723484.html They found an upward bump in temperatures during WW2,…” Oct 3, 14:02
mayazoe on Russian research assumes new ice age.: “Hi I found your site by mistake when i was searching yahoo for this acne issue, I must say your site is…” Sep 8, 10:23
gadis poker on “Climate” – a creation of corrupted people – COP21: “interesting articles and this is my first first reading a very interesting article thanks for this article that fits with…” Aug 5, 20:58
gadis poker on “Climate” – a creation of corrupted people – COP21: “interesting articles and this is my first first reading a very interesting article thanks for this article that fits with…” Jul 13, 09:15
asia global renert on “Baltic 2” another climate change factor?: “I got what you mean , thanks for putting up.Woh I am thankful to find this website through google.…” Apr 24, 00:40
Black magic Specialist India on Incompetence in ocean matters continues.: “We should stay connected to this blog because this blog teaches us something new every day.” Apr 21, 06:23
vashikaran specialist in delhi on Incompetence in ocean matters continues.: “After a lot of struggle I found this blog.I liked it by connecting to your blog.I want to thank you…” Mar 13, 07:01
Visakhapatnam escorts on Incompetence in ocean matters continues.: “this is the nice way to get knowledge and rare info from blog and your blog is the best for…” Mar 10, 13:08
Delhi on Incompetence in ocean matters continues.: “what a fabulous content writing skills. Great job and you are fantastic you providing good informative knowledge free of cost.…” Jan 19, 08:41
Bhopal on Incompetence in ocean matters continues.: “it's one of the best blog on the internet, seriously. I'm so gald to find this type of blog beacause…” Jan 2, 11:43
gandianarta on Oceans Govern Climate: “interesting articles and this is my first first reading a very interesting article thanks for this article that…” Oct 30, 23:09
Senna Bowle on Extraordinary sea ice case 1917 ignored: “I like the idea that it is man-made. Here in the Baltic we fear changes in the North Atlantic.” Mar 18, 19:29
 situation had not existed for over 150 years and meteorologists had predicted the opposite. The reason: after the two winters in Europe 1939/40 and 1941/42 were extremely cold and snowy, a third extreme winter in a row was ruled out. This has never happened since there were weather records. The forecast turned out to be catastrophic, but on the other hand revealed incompetence in metrology, which turned out to be a blessing for the course of the war. Hitler and the German Army got their Waterloo and the end of the earlier blitzkrieg successes.


 Meteorological Service records of the minimum temperatures for the Moscow area in late 1941: October, -8.2°C (about +17°F); November, -17.3°C (+1°F); December, -28.8°C (-20°F). On 30 November the already mentioned Marshall von Bock informed the Chief of Staff of the German Army, that his men face temperatures down to -45°C (-49°F). Exaggerated or not, the winter came much too early and exceeded all expectations. The misery continued to last, enhanced by heavy snow and snow drifts. The Blitzkrieg versus Russia ended already in early December 1941, and marked the beginning of the end of Adolf Hitler’s great power aspirations.
 titles, which can be attributed to an individual person, from war criminal to Holocaust mass murderer. This should comprise calling him to be the first climate criminal. Assigning Hitler the designation as a climate criminal could already be determined after the first three years of the war. All that was needed was to take the published observations of A.J. Drummond seriously in 1943 and investigate the case. The decisive findings are as follows:


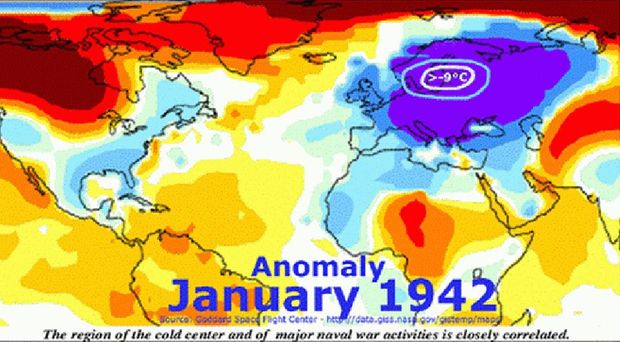


 10 kilometers into the sky and that the majority of the ash was headed northeast into the Atlantic Ocean. That occurred four days short of the 42nd anniversary of the last sizable eruption, in 1979, and a previous eruption in 1902 killed some 1,600 people. Meanwhile on April 11, about 16,000 people have had to flee their ash-covered communities. Experts warn that the explosions could continue for days or even weeks, and that the worst could be yet to come. The latest news report reads: Fri, 23 Apr 2021 : Soufrière St. Vincent volcano vigorous eruption yesterday


 low clouds on the horizon from Reykjanesbær and Grindavík. The eruption site is in a valley, about 4.7 km inland from the southern coast of the peninsula. The coastal town of Grindavík is the closed populated region to the eruption site, located approximately 10 km to the southwest.


 t Office assumes that the volcanic activity could occur near Fagradalsfjall, 20 miles south of Reykjavik, or near the Keilir mountain close by. That would be the first in the region in 800 years, which spanned from the 11th to the 13th century. Now again the alert is high and the concern modest. Iceland’s scientists have a lot of experience, as there are 30 active volcanoes on the island. Presumably there will be an effusive eruption, rather than explosive, is the likely option it is said, and it looks like we are on time. Is the world prepared for a major volcano eruption in the Northern Hemisphere?


 records 1’000 tremors in a whole year, observed more than are 40’000 during the last few weeks. Few quakes were as strong as magnitudes of 5.7., on the volcanic explosivity index. On 19th March 2021a volcanic eruption near Reykjavik has begun! Whether the impact will be wider or less than the Eyjafjallajökull just a decade ago, remains to be seen. If it happens to reaches the impact comparable to the last major volcano eruption Krakatoa in August 1883, the damage to global civilization would be immeasurable, maybe few dozen times more serious than Covid-19. We talk on climate change but only concerning warming, not about a cooling, or a sky full of ashes.. The last serious volcano incident happened 128 years ago, but its impact seems forgotten and ignored by the people, the politicians and science. Climate scientists warn about global warming, but seem blind about a case which reduces the sun-ray reaching the earth surface over few years. By a similar incident the impact on the modern industrialized world be unimaginable destructive. But the talk is only about global warming, with nowhere a Plan B in sight.


 Unfortunately it didn’t happen. More than 130 years later the Krakatoa matter is insufficiently understood and explained. For example a recent research by Zambri et al. 2017 claim, that “Observations show that all recent large tropical volcanic eruptions (1850-present) were followed by surface winter warming in the first Northern Hemisphere (NH) winter after the eruption”. Even worse argues Willis Eschenbach (WUWT) saying “Krakatau, largest eruption in recent history, shows almost no effect on the winter. It’s just about average”. The use of statistics in this way is frightening.
 In the year following the three volcanic eruptions in 1883, including Krakatoa in August 1883, the circulation in the atmosphere was above normal and then sank to a powerfully developed minimum in 1888, wrote Artur Wagner in his discussion of climatic change in 1940[37]. At the most, a reduction in solar energy could be caused only by fine dust at high altitudes. Other authors also refer to Krakatoa only from the standpoints of blockage of sunlight and as a cause of ice ages[38]. Even today, the discussion of large-scale volcanic eruptions is limited to the determination that it can become colder for a short period of time[39]. Little is left of Neumayer’s euphoria of January 1884 and – as it appears – there have hardly been any advances for science. Did Krakatoa really leave behind so few traces, or were they simply not recognized?
 It would seem that a reduction of solar radiation of such proportions would necessarily have a long-lasting effect on atmospheric dynamics. But supposedly the average temperatures fell only slightly[43] and the atmospheric circulation in 1884 was above normal and did not sink to a strongly developed minimum until 1888[44]. While the equilibrium of the world of statistics may not have been disturbed by Krakatoa, events were rather different in the world of nature. Without the stabilizing effects of the ocean, the effect of Krakatoa would have been catastrophic. A person sitting in warm bath water does not experience any discomfort when the heating is turned off – at least, not right away. But what can possibly happen to the higher latitudes of the earth if the warm water from the tropics is already on the way? A cooling-off effect will only become noticeable after the passage of some time and continued blockage of solar radiation. The influence of the oceans was shown clearly by the fact that coastal areas had above-average temperatures in 1884, whereas continental land masses such as Russia, Siberia, India, China, Canada, and the USA (inland areas far from the Atlantic) recorded very cold winters in the years up to 1888[45].
 If climate is explained by average weather conditions and the oceans are allowed only a static place in events in Nature, as was the case until recently, then we really could go on with our daily affairs and regard Krakatoa as no more than an interesting event in Nature which gave us some beautifully dramatic sunsets. But when the oceans temporarily cool off, it does not mean that heat is withdrawn in equal measure everywhere from the upper ocean layer. As the oceans comprise a chaotic system[47], it must be assumed that the tendencies in the entire system change when an event such as the eruption of Krakatoa takes place and has an effect over a period of three to four years. The fact that the sum of the statistical values (particularly the global average temperature) showed little or no deviation cannot be proof that the event did not have any climatic quality whatsoever. An event which reduced the solar radiation by about 10% for more than three years cannot have failed to influence ocean currents and must have had to one extent or another short- as well as long-term consequences. In addition, the possibility that the oceans reacted in some way to a three-year “cleaning of the sky” of volcanic ash, pumice dust, and sulfuric acid, more than 2/3 of which landed in the seas, cannot be categorically excluded.


 models had even the slightest hint of reliability, there would have to be at least something in the forecast that an El Niño will have had a large impact on the weather since autumn 2020. That turned out to be completely wrong. A La Niña has dominated the scene for more than a year and continues to do so. Such failures raise the question of whether science even understands what it is trying to talk about.


 Arctic Sea ice is a big concern in the climate change debate. During the last 100 years three major shifts occurred. Less sea ice from 1918 to 1939; more sea ice formed from 1940 to about 1980, and retread again thereafter. Meanwhile the ice situation in 1939/40 is close to the conditions today, as just published paper by Guillian Van Achter et.al. , assumes (see next image). While the latter point is important to recognize, the authors fail taking in account what happened in the last century, with the high probability that the two major shifts have been caused by two devastation naval wars.


 took place around the United Kingdom for 4 years, in the North Sea and also over the Gulf Stream. This messed up the “natural sea water structure” in terms of temperature and salinity and all these water masses ended up high up in the north. This caused a change in the water structure there. The mighty, cold, thick surface layer became thinner and so the warm Gulf Stream water could give off much more heat to the atmosphere. For two decades significant higher air temperature was observed in the Northern Hemisphere, ending suddenly with the beginning of World War II in September 1939.

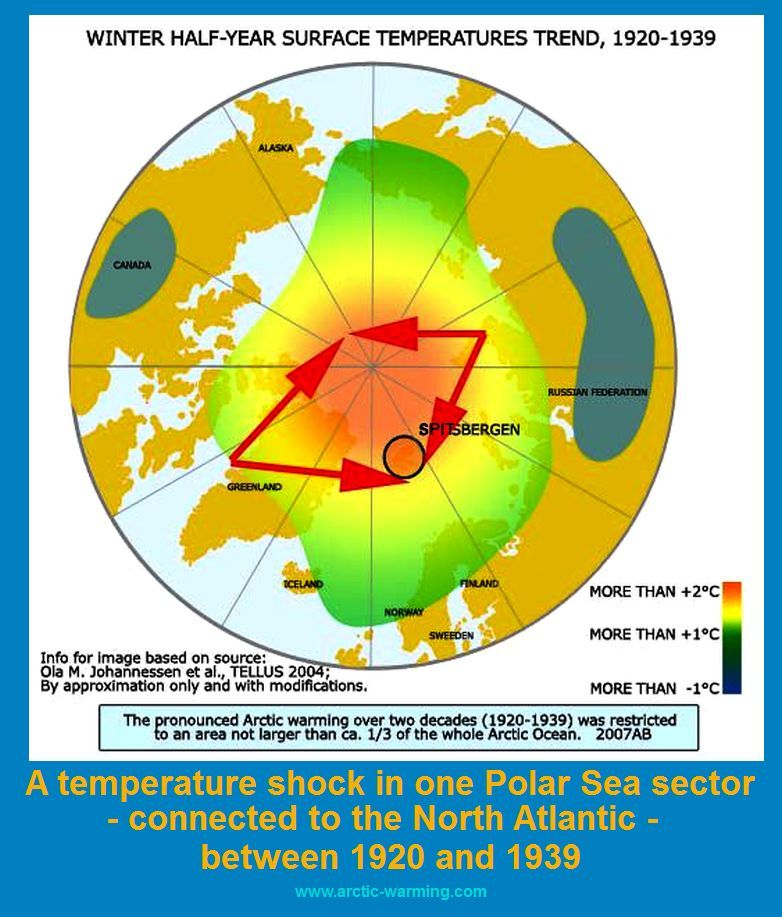

 period was required “to heal the sea from the wound WWII had inflicted”. About 3 to 4
  decades to turn the cooling and increased sea ice trend back to a warming trend. And 3 to 4 decades to reach the same level as it existed in the late 1930s. In so far it is to note, that the lowest point was about 2012, but the sea ice is today back to the extent in 2005, in other word, the situation has stabilized during the last decade.


 published in NATURE, [Vol.453, 29May2008]. Whereas they confirmed that the Earth warmed from 1910 to1940** the subsequent cooling is explained very superficially, namely by a “variety of physical factors, such as atmosphere–ocean interactions and anthropogenic emissions of sulphate aerosols” and of “uncorrected instrumental biases in the sea surface temperature record”. That the large discontinuity has a strong correlation with World War II is not even mentioned.


 Immediately Bob Tisdale (2009) question the conclusion, due to obvious similarities in the shifts of the SST , the cloud cover and the marine air temperature datasets, but either ignoring human activities at sea in the 1940s as well. One dozen years earlier two papers discussed “Temperature taken during World War II” [in the Pacific; in the North-Atlantic], by showing that a huge variety of observation need to be analyzed before considering any ‘corrections’. But as Tisdale wonders that Thomson et al pay not any attention to other datasets showing the discontinuity as well, he either is short in asking the question: What is the cause of the observed discontinuity in the 1940s.


 to misery of war. January 1940 was coldest month on record for almost 50 years, freezing the river Thames. This year THE TIMES is earlier and published today (14/01/2021) a story about January 1940, titling it: Wartime ice storm turned UK into a strange frozen world.


 the month, the river Thames in London had frozen over for the first time in six decades, while on the 21st, temperatures in mid-Wales plummeted to a record low of –23C. But the most serious event came towards the end of the month, when a clash of mild air from the south-west and cold air from the north-east produced very heavy snowfalls, including 1.2 metres (4 ft) of snow in Sheffield. In southern Britain, rain fell instead of snow, resulting in an even greater catastrophe, as trees, telegraph and power lines were all coated with a thick layer of ice – up to 0.3 metres in some places. This was too much to bear, and many branches and lines collapsed under the sheer weight of ice. To make matters worse, it then snowed, creating even more misery for people already bearing the burden of war. Known as the 1940 Ice Storm, this goes down as one of the most dramatic weather events in history.


 temperatures in Western Europe are above zero degrees Celsius. Not so eight decades ago. A dramatic drop stopped the warm winters in Europe. The situation turned to winters observed before the end of the Little Ice Age (~1850). For example: the coldest winter (November to March) since 1828 in Dresden and Berlin. All-time low ever observed and recorded, in Poland (-41°C), in Moscow (-41,2°C) and Wales (23.3°C). That came completely unexpected. What a drama. Not for climate science, which has not been interested in this sudden climatic shift until today? Does that indicate a lack of competence?


 12. February 1940. A month earlier Poland reached to an all time low, which brings us back to the current gathering in Katowice. In 277 km distance in NNE and about 50km west of Warsaw is the village Siedlce. Already on the 11th of January 1940 the thermometer dropped to the incredible level of minus 41°C. At that time the Baltic Sea was still not covered with sea ice, which only happened in early March 1940, and for the first time in the 20th Century. How that could happen so suddenly, after the year 1939 had been within the normal temperature range, actually there had been a lasting warming since 1918, and the late 1930s had been the highest ever recorded.


 That happened evidently in winter 1939/40. And what is climatology doing? They ignore it, although it would turn the whole climate change debate in a complete different direction. Evidence would be on the table that man is able to a moderate winter scenario into a disaster within a few months. One mad-man as Adolf Hitler is enough to cause the coldest winter in Europe over more than a century. The Katowice climate summit brought together around 30 000 delegates from almost 200 countries, top state officials, representatives of business and NGOs among them, but without the competence and interest to answer a fairly simple question: What cause the sudden climatic change in winter 1939/40? Which atmospheric condition caused the all-time cold record in the village Siedlce on 11th January 1940 and several other locations? An all-time record in Hamburg one month later?. What caused the full ice-cover of the Baltic Sea after more than 40 years?


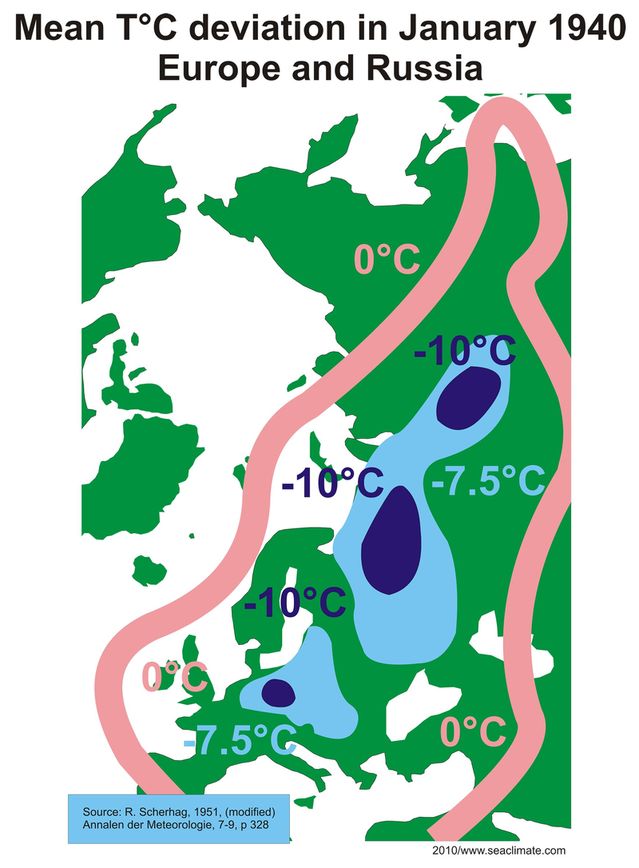


 left). In August, 1922, the Norwegian Department of Commerce sent an expedition to Spitzbergen and Bear Island under the leadership of Dr. Adolf Hoel, lecturer on geology at the University of Christiania. Its purpose was to survey and chart the lands adjacent to the Norwegian sea mines, laid during First World War (WWI) on those islands, take soundings of the adjacent waters, and make other oceanographic investigations.


 time it has steadily gotten warmer, and that to-day the Arctic of that region is not recognizable as the same region of 1868 to 1917. Back in 2003 Willis Eschenbach did a closer examination of Vardø (see the Vardø –above) and also found the same discontinuity around 1920, amounting to 0.73°C. When that artificial discontinuity is discounted, the temperature rise is only +0.12°C per century, a tiny result for a region that according to the models should have undergone rampant warming in the last century. The text was published in October 2003 (see left) at http://www.john-daly.com/press/press-03b.htm , in Willis Eschenbach’s eyes the late John Daly was an early giant in the climate blogger sphere.


 (Weikmann, 1942). During the winter of 1918/19 the temperatures varied considerably. There were long periods in November and December 1918 with temperatures close to zero degrees, 4 days with temperatures above zero in November and 7 days in December[38]. In January 1919, the temperatures did not reach -5oC for 14 days, and five days were frost-free. The annual mean (1912-1926) with a minus 7.7oC suddenly jumped to an annual average of minus 5.4oC in 1919, representing a plus of 2.3 degree. The corresponding figures provide for January 1919 a difference + 8.6oC, which indicates that the sea was able to transfer a lot of heat into the air. However, during February-April 1919, the temperatures were well below the average (ca. -6oC), with a large ice-cover far out into the sea. But that did not affect the significant warming that had started a few months earlier and lasted until the outbreak of WWII in September 1939.
  The dramatic temperature rise in the 1920th and 1930th is shown in several of the Fig. attached.


 A climatic tipping point is good for what?
 and does not return to the initial state even if the drivers of the change are abated. For the climate system, it refers to a critical threshold when global or regional climate changes from one stable state to another stable state.
 It actually means nothing else as the interaction of nature, which explains nothing. All that this boils down to is ‘the interactions of the
  natural system’. What is the point of a term if it explains nothing? (See Letter to Nature, 1992)


 perturbation can qualitatively alter the state or development of a system. The same authors: T.M. Lenton, S. Rahmstorf and HJ. Schellnhuber, et. al, published recently again an article in NATURE, 27. Nov. 2019, titled: “Climate tipping points — too risky to bet against”. They talk about ice collapse, biosphere boundaries, global cascade, offering nothing more than the believe, that by strongly forcing the system, with atmospheric CO2 concentration and global temperature increasing at rates that are an order of magnitude higher than those during the most recent deglaciation. Not one word can be found that the earth got warmer since the end of the Little Ice Age, around 1850, about 100 years before consumption of fossil fuel raised the CO2 level significantly. Not one word about the entire impact of the ocean and the impact of human activities at sea may have had since industrialization commenced. But like their paper in 2008, their tipping-points scenarios aim to raise scare, concluding with the warning: „We argue that the intervention time left to prevent tipping could already have shrunk towards zero, whereas the reaction time to achieve net zero emissions is 30 years at best. Hence we might already have lost control of whether tipping happens. A saving grace is that the rate at which damage accumulates from tipping — and hence the risk posed — could still be under our control to some extent.The stability and resilience of our planet is in peril. International action — not just words — must reflect this.”
 Even the skeptical think-tank Global Warming Policy Forum (GWP), adopted the claim that “Global warming alone is insufficient to cause such a tipping point”, and that a better “insights into the role of water vapor may
  help researchers predict how the planet will respond to warming”. They cite an analysis by the MIT (Massachusetts Institute of Technology) in September 2018.The mere reference to atmospheric water vapor is very naive, because to a very high degree the oceans control it (see Fig. below). In a world were annually averaged sea surface temperature is about 16°C, but the overall ocean mean temperature are merely +4°C , even mentioning a tipping point, would indicate incompetence in climatic matters. That applies also to the above cited authors, T.M. Lenton, S. Rahmstorf and HJ. Schellnhuber, when they refer in their 2019 paper, inter alia, to parts of the oceans, in the Arctic, Antarctic and North-Atlantic. Discussing the general term tipping point without having a thorough insight into the interior of the oceans is a hopeless undertaking, if at all possible.


 In autumn 1939 there is war in East Asia, and war in Europe. And suddenly the weather produce records, from wettest to coldest, across the USA.
 condensation nuclei had anything to do with it. The less humidity is in the atmosphere, the more easily it can be replaced by colder air. If the amount of water in the atmosphere is less than average, the ‘vacuum’ thus created, needs to be filled by air. The fact that the Northern Hemisphere was in such a state towards the end of the year 1939 is very likely and science could have found out why long ago. The USA had records in September, in November and December, which made it easy for Arctic air to travel south to filling up the gap. A detailed assessment is at: http://www.seaclimate.com/c/c4/c4.html,
 only tropical storm to make landfall in California in the twentieth century. The air pressure went down to 971 mb, and the excessive rain caused heavy flooding, e.g. September records in Los Angeles (5.24 inches in 24 hours) and at Mount Wilson, 295mm/11.60inches). It was the heaviest September rain in Los Angeles’ weather history and it broke the worst heat wave in Weather Bureau records, as measured by intensity and duration. (NYT, Sept.26,1939).
 Except for a few States in the east (see above), the fall season was extremely dry over large areas. For all the areas east of the Rocky Mountains it was the driest fall on record (Martin, 1939). For about 9 States it is the all-time record and the dryness must have severely affected southern Canada as well. Time magazine titled on December 25th, 1939: “WEATHER: Driest Fall”, and reported “the driest fall on record, a severe case of spotted drought affecting 97,000,000 U.S. acres. About 16 States had less than 33% of their normal November precipitation.
 After extreme amounts of precipitation in September and dryness in November (see above) December came along with another curiosity. The overall monthly temperature record was considerably above average (TM5). In three States the all-time record had been observed. In the east, a change was already expected for the beginning of the holiday season: “White Christmas is likely for city” (NYT, Dec. 23, 1939). It took a few days longer for winter to come. On the 28th, it was time to report: “A biting northerly, driving grey, snow-laden clouds before it, brought to New York yesterday the coldest day of the winter. Shortly before 10 A.M. the mercury dropped to 11.9°F above zero”(11°C), (NYT, Dec. 28). Soon in 1940 the “Winds sweep the city as cold grips the U.S. ”, with “a mark of 11°F below (-24°C) in Indiana (NYT, Jan. 07, 1940. An exceptionally cold January 1940 had reached the United States , as shown in Figure 2 (above)

 The Timing: The ‘timing’ between excessive rain in Europe and the dry months in the United States is a perfect indication of the relationship between both events. Any ‘interchange’ between dry and wet air takes its time. A dry or humid air body can exist from up to several days to a few weeks. An ‘air body’ needs a couple of weeks to circle the Northern Hemisphere. Scherhag (1951), analysed a disruption in the circulation of air in the winter of 1940, and states with regard to air movements that there must have been a subsequent air-body-transfer (“Massentransport”) from the Southern Hemisphere towards the Arctic, which means, that ‘dry air’ from Europe could have circled the globe for some time before a ‘humidity gap’ could be refilled. This also confirms that there was a ‘humidity gap’ in the first place. If the ‘dry-out’ had not been caused by military activities, what else could have caused it?
 Lower air circulation: The winter of 1939/40 was the result of a comprehensive general disruption of the atmospheric circulation, which could be regarded as a ‘prototype’ for a weakened circulation. Less humidity in the atmosphere and lower temperatures in seas and oceans, due to naval warfare in the waters of Northern Europe , inevitably caused disruptions in atmospheric air movements.
 severe winter, the coldest in one hundred years in countries bordering the most war-affected seas in Northern Europe, did not come ‘just out of the blue’, but it was a combination of too dry air circling the hemisphere and naval operations in the marine environment of Europe.
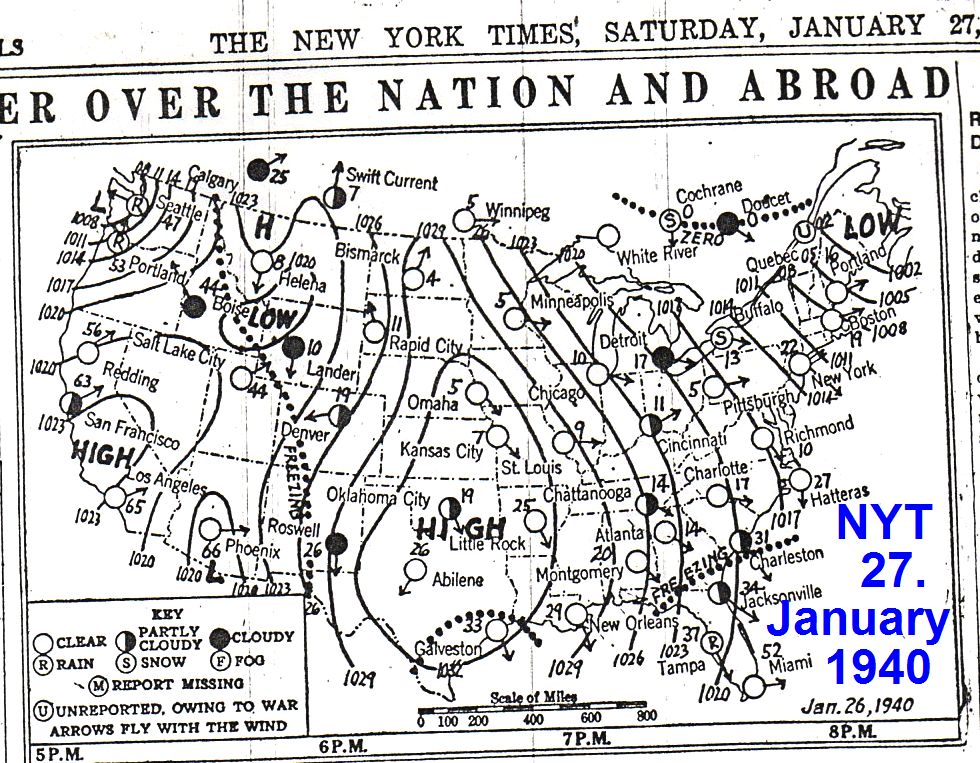
 Climate change has two sides. If natural we do not need science. If we assume it could be man-made, competent
  science is needed to explain why and able to say what needs to done to prevent it. Here we raise a very significant weather event, which science has never attempted to explain, even eight decades have passed. What a big mistake!

 Quote:
 most horrible sight I had ever seen. As if the men had been suddenly turned to wax, there were two or three thousand Russians and a few Finns, all frozen in fighting attitudes. Some were locked together, their bayonets within each other’s bodies; some were frozen in half-standing positions; some were crouching with their arms crooked, holding the hand grenades they were throwing; some were lying with their rifles shouldered, their legs apart….Their fear was registered on the frozen faces. Their bodies were like statues of men throwing all their muscles and strength into some work, but the faces recorded something between bewilderment and horror”.


 The very cold Christmas in Finland 1939 was only the beginning of a dramatic winter in Europe. It became the most severe in many parts of Europe for more than one-hundred years. There are plenty indication that the war contributed heavily. But neither meteorology nor climatology have ever shown any interest, on either confirm the anthropogenic massive contribution, or demonstrate competence by naming a different causation of the extraordinary winter 1939/40.
 Poland had already over-run and Warsaw already “burned down” in September 1939. In the European war scenario, the war activities in Finland during December 1939 were only a “sideline” in the whole war picture. Nevertheless, the NYT Christmas story reported a remarkable event, serious enough that should have caught the attention of science.

 nowadays science does not know why. They never connected this event with the fact that it occurred after a devastation war in Europe from 1914 to November 1918. The rise continued less pronounced all over the Norther Hemisphere., in some regions up to two decades. Fifty years later, after a cooling period from 1940 to the mid-1970s warming resumed and science explained that it was due to the human produced release of carbon dioxide ()CO2) in the atmosphere, which would diminish the sea ice the Arctic regions and increase climate changes. But why had they been unable to investigate the causes for the warming. More than one-hundred years have passed? A anthropogenic contribution of CO2 was it for sure not. Do they fear such finding could destroy their theory on the greenhouse-effect? One key to understand any climatic shift is the Arctic. Although it is a top topic in science since several decades, it is outrageous how superficial the question on climate change in 1918 is handled.
 A recent paper “Rapid reductions and millennial-scale variability in Nordic Seas sea ice cover during abrupt glacial climate
  changes” by researcher Henrik Sadatzki, et al. (1) from the Niels Bohr Institute, at the University of Copenhagen, claims that abrupt climate change occurred as a result of widespread decrease of sea ice. By analyzing the last glacial period, app. 10,000 – 110,000 years ago the Northern Hemisphere was covered in glacial ice and extensive sea ice, covering the Nordic seas. But as soon as the Nordic Seas changed abruptly from ice covered to open sea, the energy from the warmer ocean water was released to the cold atmosphere, leading to amplification of sudden warming of the climate. The study concludes, that sea ice is a “tipping element” in the tightly coupled ocean-ice-climate system. This is particularly relevant today, as the still more open ocean to the north can lead to similar abrupt climate change.


 mid-1970s. In both cases neither an increase or decline in sea-ice cover, show up as significant contributor. As the sun can be excluded concerning the EAW during the winter season in the higher Northern Hemisphere, the only cause remaining is a substantial shift in the structure of the Nordic Seas, which are likely to have caused by two factor.

 Naval War, 1914 to 1918, a force to recon
 natural commons, had been observed in the North Atlantic or Arctic region, or at a global level. There was no significant earthquake, no eruption of a forceful volcano, no tsunami, no sunspots, and no big meteorite fell on the continent or into the sea. But with the commencement of the First World War (WWI) the situation changed.


 structure of the water had certainly changed its composition.

 What does a system shift mean in respect to the Spitsbergen/Arctic region? The main answer is simple. The
  incoming warm water of the West Spitsbergen Current was “positioned” in a manner that it could release more heat into the atmosphere. This can happen in two ways: I.) the sea ice forming during the winter season diminishes, which would not explain the suddenness of the shift; or II.) the thickness of cold sea water layer above the warm water was suddenly substantially reduced so that the air temperatures could immediately benefit from warmer water close to the sea surface. This was actually the case. In the mid-1930s it had been already discovered and published, that since the FRAM expedition in 1893-1896 the cold surface layer had grossly weaken, observed the Russian oceanographer J. Schokalsky, 1936 (3):

 What further evidence is required to attribute the EAW from 1918 to the 1930s to naval war activities during WWI? This knowledge is necessary in order to better understand the mechanisms between sea, sea ice, atmosphere and human influence on processes in the Arctic. The sudden shift into the EAW, was a significant climatic change event, strongly enhanced by naval war activities. Instead of analyzing the last glacial period, app. 10,000 – 110,000 years ago, a thorough understanding of what the WWI caused changes in the North Atlantic and Arctic Ocean and subsequently on weather and climate is urgently required. Henrik Sadatzki, et al. conclusion that sea ice is a “tipping element” in the tightly coupled ocean-ice-climate system, would certainly require a revised and more convincing classification.
 than Earth at the center of the universe, by convincing a few of his ccontemporaries that the Earth was a spinning ball and not flat. Eventually the subsequent generations accepted the view. Particularly for earth sciences a breakthrough, encouraging all disciplines to keep an eye on the whole picture. However, if it comes to the climate debate, one may could ask, whether science has focused its research and analysis too closely, which could raise the impression that the climate debate is based on view comparable with those before Copernicus: The Earth Is Flat.
 The paper mentions the sun, but is silent on the global mechanism between the sun and the oceanic water masses, and that primarily the ocean temperature structure matter. It says:
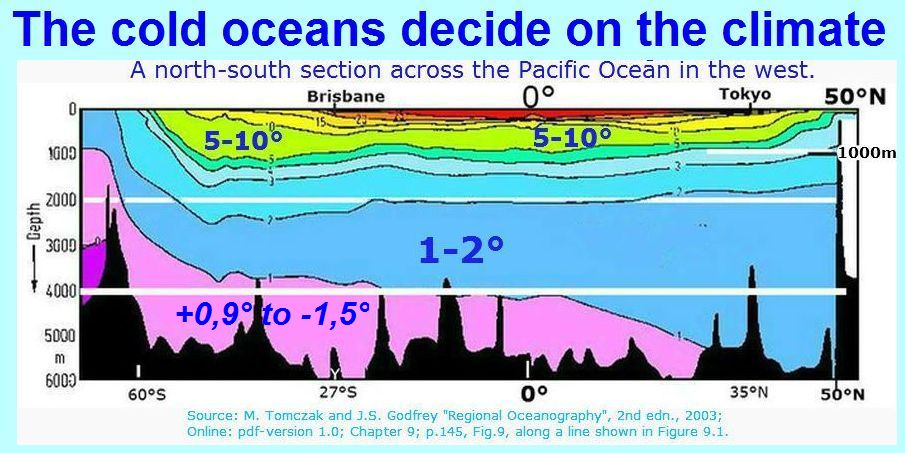
 Even more distinct from the ‘law of physics” is the reference to fluctuations of atmospheric pressure at sea level (SLP) between the Icelandic Low and the Azores High, known as NAO. Calling it a “weather phenomenon” (see Wikipedia about NAO) or “Natural Factor”, is so close to the point as the forbearer of Nicolaus Copernicus understood their world, as the center of the universe and flat.
 connected to two world wars, already fairly well documented at that time, with abundant observations, fully available to identify human influence on the weather and climate due to activity at sea.
 Obviously, the authors (in total eight) attempt to link a five-year climate change and a pandemic with “tens of millions of victims “. Whether that is scientifically well founded and makes sense, and is helpful to for a better understanding of the current COROA 19 pandemic is solely their responsibility. On the other hand the aspect, what happened to the weather during the six war years, raises our interest greatly.
 one condition the other? But the paper is completely silent on any consideration, what may have caused the great weather anomalies during the very limited time period from 1914 to 1918, mentioning merely in very broad terms: “The environmental and especially climatic conditions in which the pandemic developed have received less attention in the scientific literature, even though historical accounts universally describe abnormally high precipitation and cold temperatures”, or by references to a few subsequent observations for example: During the battles of Verdun (1916–1917), the Somme (1916), the Chemin‐des‐Dames (1917), and the Third Battle of Ypres‐Passchendaele (1917) (Barbante et al., 2004; Hussey, 1997).”
 from 144 countries (Wikipedia ), and founded in 1919, intended to promote geophysics, has missed to understand, that “oceans make climate”, and warfare shaped the weather across the war areas and beyond during WWI and thereafter (see references at text end), is a hard to understand this failure.


 ‘infectious diseases” and “climate change”. In both cases, the ability to look ahead and the crisis management are not very convincing. While dealing with pandemics has recently proved far less that reasonable, preparing for “climate change” is a disaster, if merely meant as “global warming”, and only described as “climate change”, which should be in the long run regarded as “climate crime”, according a UNESCO publication (see Fig. on the right). Ignorance and blindness is not good for the future of mankind.


 trouble can been seen by the developments after TAMBORA, The surface temperature anomalies during the summers: 1816, the “year without a summer” were −0.51 °C (−0.92 °F); summer 1817, −0.44 °C (−0.79 °F), and summer 1818, −0.29 °C (−0.52 °F). During the northern hemisphere summer of 1816, cooling directly or indirectly shall have caused 90,000 deaths.
 On the other hand, a lasting heavy human impact at sea, over several months or years, can lead to a regional cooling in Europe as during the winters 1939/40, 1940/41 and 1941/42, and a global cooling subsequently until the mid.1970s. More: HERE. During the Second World War, the weather was documented many folds higher than any time before. It was the longest cold period after the end if the Little Ice Age around 1850. Until now the reason for the three decades cooling period has been neither thoroughly investigated nor explained. With the billions spend in climatic research since long the impact of shipping and other activities at sea on global warming since the later 19th Century should have been done since long. But not one dollar has ever been spent. It is difficult to consider this not as a shocking failure of climate sciences.
 changes are at stake. Human behavior can influence the direction, warming them up or cooling them down. A major failure, if not tragic irresponsibility, however is, if one of the inevitable possible events, warm or cold, is completely ignored. Not planning for this and not having Plan B is grossly negligent and could, one day, be classified as a “climate crime”. The current pandemic (see above) is evident for too little pre-preparation.
 (1769 –1859), the great German naturalist and geographer defined climate as ‘all the changes in the atmosphere that perceptibly affect our organs’. According A.v.Humboldt, ‘climate’ was even closer to the skin of any person than their dresses were during day and night. The intellectuals those days lived closer to nature than academics nowadays.
 During A. v. Humboldt’s lifetime, meteorology was emerging and still at a low level. Now for more than 100 years acknowledged as an academic discipline, scientists remained incapable to tell what ‘climate’ is, respectively formulate terms, which indicate incompetence, explaining nothing, and are completely useless in scientific research. In the early 20th Century climate was defined as average weather and in the 1930th the thirty-year period from 1901 to 1930 considered as the baseline for measuring climate fluctuations. Several decades later the prominent meteorologist H.H. Lamp regarded the definition of climate as “average weather” quite inadequate, mentioning that until recently climatology was generally regarded as the mere dry-as-dust bookkeeping end of meteorology (FN. 1). Also the either well-known F. Kenneth Hare wrote in 1979: You hardly heard the word climate professionally in the 1940s. It was a layman’s word. Climatologists were the halt and the lame (FN. 2).
 There is no other explanation for such a junk than crazy. It is completely unusable as a work base in scientific research, and misleading in any communication with the public and governments. As a daily slang word, which is close to everybodys’s skin than its shirt, it is an abuse every time a scientist is using it. This is presumably a major reason that the climate-change debate has been getting more and more hysterical during the last decades.
 layman is able to use and explain the current weather in presumably several hundred versions, and ‘popularly weather’ is extremly far awayfrom a transparent and workable academic term, as explained above. Either the distinction between present and past weather is nonsense: Weather is weather, and statistic on atmospheric conditions, whereas numerical data, whether collected in the present or in the past remain a statistic. Once statistic always statistic. Not naming the ‘possible conditions’, nor the time period make it worse. Only the first sentence of the AMS weather definition is acceptable, saying:
 The story of the complete incompetence of the scientific terminolog does not end at this point, but it makes little sense to discuss scientific terminologies, which are at best a joke and belong in the garbage heap.
 About the Author
 public that they understand what they are talking about, namely weather and climate. This has dramatic consequences, as the student demonstrations show on many Fridays in the past months. No one seriously denies that the air temperatures have been rising in the last 150 years. This can generally be summarized under “global warming”, if one generously ignores the two major temperature changes from 1918 to 1939 (increased warming) and 1940 to 1975 (strong cooling). Both events are strongly correlated to the big naval wars, 100 and 80 years ago, as prima facie proven HERE. The simple truth is that temperature changes and climate changes are not the same. Between layman’s weather and what science understands as such they are worlds apart. An overview is shown by the image – right hand, enlarged, below.


 like U.S. President Donald Trump, others regard it as real, respectively as an issue that affects the whole of humanity, the future of humans depending on it. As long as only the rise of local or global air temperature is viewed, this is certainly correct. But that is rarely the case. Overwhelmingly all refer primarily to a threat by climate change, which is a distinct issue from a rise of air temperatures. Indiscriminating use of both term simultaneously is a fretful failure, leading to misinformation, disguising, and, if intentionally, a gross delusion. In the way science has been using the word climate over the last decades, the general public and politics is misguided since long. The reason is that science has been incapable to demonstrate that they understand what climate is, and able to define the terms they work with. Actually they use a layman term, broadly understood as average weather (for example the summer season in Florida), as greatest threat facing our world by calling it “climate change”. That is irresponsible and in an objective sense delusion. Let’s have a look at the term climate as used by science and climatology.
 President of the American Meteorological Society, used nine simple words: “weather is your mood and climate is your personality.”
 Similar shocking is not to realize that if one wants to explain “climate change” that it is a
  paramount condition to say what the subject of change shall be. This nonsense is topped when saying: “‘Climate change’ means a change of climate…” (More details see Fig. left). According the Dictionary of GLOBAL CLIMATE CHANGE (1992) by W. John Mauder, (pp. 240):


 The most proeminent institutions on climate are the Intergovernmental Panel on Climate Change (IPCC) and the American Meteorological Society (AMC). Today they have both lengthy glossaries with more than 12,000 terms (AMS), or over 52 pages (IPCC) respectively. Remarkable – they are both concerning the term climate. On one hand, they differ extremely from each other. On the other hand, each text on climate is at best a joke as an academically reasonable definition. They are both useless in the field of scientific work, and of such big lack of clarity that they undermine any fair and explanatory communication between the general public and politics.


 The AMS Glossary offers a different approach. The definition begins with the sentence: “climate is the slowly varying aspects of the atmosphere–hydrosphere–land surface system”, see full text Fig. 8. It is all the Glossary tells about the meaning of climate. It is virtually impossible to make any sense out of it. A definition of ‘nature’ could go equally. All that this boils down to is ‘the interactions of the natural system’,
 But different from IPCC the AMS Glossary defines weather (Fig. 9). Interesting that the first paragraph confirms what was already said above, that weather is “primarily an individual impression and experience”, namely:
 of people. The earliest notions of ‘klimat’ were linked to sun inclination, and latitude. Over 2000 years the term climate is a solid public domain. Like weather, the word reflects a general impression. People not necessarily like to talk about climate and weather, but need to find out, which issues are needed to have an informative conversation, e.g. temperature, sun shine, rain, wind, etc. In countries with quickly changing weather conditions, as in Western Europe, the talks on weather are more intensive and lengthy, as in the Sahara with little changes. It is more abstract when merely seasonal conditions for a holiday abroad, for example in Morocco in May is of interest, commonly called climate.


 of the definition.

 is high in the North, at 79°30′N 97°00′E, and well in the Arctic region. Adam Voiland
  provided an interesting text citing two scientists and their considerations concerning the possible demise of this ice cap (full text below). But is it of any help?

 Glaciologists generally classify glaciers into two major types. In temperate areas,
  where summers are relatively warm and plenty of snow falls, warm-based glaciers dominate. This type slides easily, often slipping a few kilometers each year because water lubricates the ground and the base of the glacier. In contrast, cold-based glaciers dominate in polar deserts—the cold, high-latitude areas that receive little snow or rain. This type of ice generally stays fixed in place, rarely moving more than a few meters per year.


 “The fact that an apparently stable, cold-based glacier suddenly went from moving 20 meters per year to 20 meters per day was extremely unusual, perhaps unprecedented,” said Willis. “The numbers here are simply nuts. Before this happened, as far as I knew, cold-based glaciers simply didn’t do that…couldn’t do that.”
 in the Kara Sea are sea ice, not glacial ice.)
 Willis and his colleagues are still piecing together what triggered such a dramatic surge. They suspect that marine sediments immediately offshore are unusually slippery, perhaps containing clay. Also, water must have somehow found its way under the land-based part of the glacier, reducing friction and priming the ice to slide. Observations from several satellites suggests that the northern and southern edges of the glacial tongue are grounded on the sea bottom, while the middle is probably floating, another factor that has made it easier for ice to push forward at a rapid rate.
 Hundreds of cold-based glaciers line the coasts of Greenland, Antarctica, and islands in the
  high Arctic. Together they cover hundreds of thousands of square kilometers of land. The events at Vavilov suggest that these glaciers may be less stable and resilient and more capable of collapsing and affecting sea level.

 In late January 2019, a severe cold wave, caused by a weakened jet stream around the Arctic polar vortex, hit the
  Midwestern United States and Eastern Canada. It came after a winter storm brought up to 13 inches (33 cm) of snow in some regions from January 27–29, and brought the coldest temperatures in over 20 years to most locations in the affected region, including some all-time record lows. In early February, the polar vortex moved west, and became locked over Western Canada and the Western United States. As a result, February 2019 was among the coldest and snowiest on record in these regions. In early March, the cold once again shifted east, breaking records in many areas. In mid-March, the cold wave finally retreated, but combined with above-average temperatures, precipitation, and a deep snowpack, widespread flooding ensued in the Central US. (Source Wikipedia, 1st April 2019)

 While meteorology will manage to run sufficient forecasts throughout the winter, one wonders that they have not explained what happened in autumn and winter 1939/40:
 decades, should not be forgotten, but serve as reminder that events than were anthropogenic influenced. Even the smallest percentage contributed by human activities to the weather pattern in winter 1939/40 needs to be understood and discussed in the general debate on climate change. To serve this purpose, it follows an excerpt from the Book: “Failure of Meteorology”.
 Dec. 23, 1939) was presumably not worth a doctor’s thesis at any time. Neither that the winter earnestly came in early January 1940, with a frigid wave that gripped most of the United States (NYT, Jan. 6, 1940). Icy north-westerly winds swept over New York with force, on January 6, causing temperatures to drop to an average of 10 degrees Fahrenheit below normal. Frigid waves even touched northern parts of Florida (NYT, Jan. 07, 1940).
 average, the ‘vacuum’ thus created, needs to be filled by air. The fact that the Northern Hemisphere was in such a state towards the end of the year 1939 is very likely and science could have found out why long ago. The USA had been recorded as very dry in November and early December, which made it easy for Arctic air to travel south to filling up the gap. But it all started two months earlier.
 Except for a few States in the east (see above), the fall season was extremely dry over large areas. For all the areas east of the Rocky Mountains it was the driest fall on record (Martin, 1939). For about 9 States it is the all-time record[3], TM5, and the dryness must have severely affected southern Canada as well. Time magazine titled on December 25th, 1939: “WEATHER: Driest Fall”, and reported “the driest fall on record, a severe case of spotted drought affecting 97,000,000 U.S.acres.”[4] About 16 States had less than 33% of their normal November precipitation.
 After extreme amounts of precipitation in September and dryness in November (see above) December came along with another curiosity. The overall monthly temperature record was considerably above average (TM5). In three States the all-time record had been observed. In the east, a change was already expected for the beginning of the holiday season: “White Christmas is likely for city” (NYT, Dec. 23, 1939). It took a few days longer for winter to come. On the 28th, it was time to report: “A biting northerly, driving grey, snow-laden clouds before it, brought to New York yesterday the coldest day of the winter. Shortly before 10 A.M. the mercury dropped to 11.9°F above zero”(11°C), (NYT, Dec. 28). Soon in 1940 the “Winds sweep the city as cold grips the U.S. ”, with “a mark of 11°F below (-24°C) in Indiana (NYT, Jan. 07, 1940. An exceptionally cold January 1940 had reached the United States , as shown in Figure 1 (above)
 indication of the relationship between both events. Any ‘interchange’ between dry and wet air takes its time. A dry or humid air body can exist from up to several days to a few weeks. An ‘air body’ needs a couple of weeks to circle the Northern Hemisphere. Scherhag (1951), analysed a disruption in the circulation of air in the winter of 1940, and states with regard to air movements that there must have been a subsequent air-body-transfer (“Massentransport”) from the Southern Hemisphere towards the Arctic, which means, that ‘dry air’ from Europe could have circled the globe for some time before a ‘humidity gap’ could be refilled. This also confirms that there was a ‘humidity gap’ in the first place. If the ‘dry-out’ had not been caused by military activities, what else could have caused it?
 Europe and Northern Asia. This is a strong indication that there was too little humidity in the air (as proven in the case of the USA – above), giving arctic air a free path to penetrate deep into southern regions.
 Northern Europe , inevitably caused disruptions in atmospheric air movements.
 A number of indications show that the war in Europe and in China may have significantly influenced winter weather conditions over long distances. In this case, North America had a
  severely cold January in 1940. Most likely, it had been supported by a lack of usual rain in the United States during the months of October to December 1939, in the first place due to generating condensation nuclei by military activities in Asia, in Poland and along the Western Front in Europe. The obvious “rain forcing” in autumn 1939 that caused low humidity in the atmosphere, made it easy for arctic air to forcefully travel down to the mid-latitudes of the Northern Hemisphere. The timing of ‘dry air’ and the invasion of polar air over all NH continents suggest that this was not a mere natural variation. The drier the air properties at lower latitudes are, the easier arctic air can spread southwards. The lower maritime influence is (warm moist air), the more continental conditions will prevail (cold dry air). The Northern Hemisphere felt it with full force in January 1940. A severe winter, the coldest in one hundred years in countries bordering the most war-affected seas in Northern Europe, did not come ‘just out of the blue’, but it was a combination of too dry air circling the hemisphere and naval operations in the marine environment of Europe.


 braking freezing temperatures during the last months, Europe is spared of wintery weather until now. The most likely reason is increasing ocean use, particularly by off-shore windfarms and shipping, which churn the sea like moving spoon in a hot coffee pot. While climatology is not able to consider this mechanism, any cold from the Arctic or Siberia is kept at bay. That should have been common knowledge since long, at least since the commencing days of World War II.

 on the winter conditions than and today seems contradicting. Winter 1939/40 was in many locations the coldest for up to 200 years or ever recorded, while currently climatology will soon declare Europe’s winter 2017/18 the warmest ever. The tragic is that both
  cases have the same source, man-made climatic changes, but science does not know, and is unable to inform politics and the general public correctly.

 Please check also the difference in sea ice conditions as shown in the various images.


 to the higher than the global warming of the seas around Europe. In the North and Baltic Seas temperatures increased five to six times faster than the global average over the past 25 years, and three times faster in the Black and
  Mediterranean Seas. (Related Essay in PDF) Science spend many billions to prove a correlation between CO2 and global warming, but not one cent on how shipping, fishing industry and naval activities in war time have influenced weather and climate conditions since the end of the Little Ice Age around 1850. Climate science behaves irresponsible.


 A previous post asked: “Europe winter free – Thank to off-shore windfarms” one year ago? Comparing the current
 sea ice conditions with those of long-term average, raise the curiosity even further. There is even less sea ice as a year ago. Two month ago, the Met-Off discussed the possibility of another “Beast from the East’ early in 2019?” This side commended:


 extensively discussed HERE.
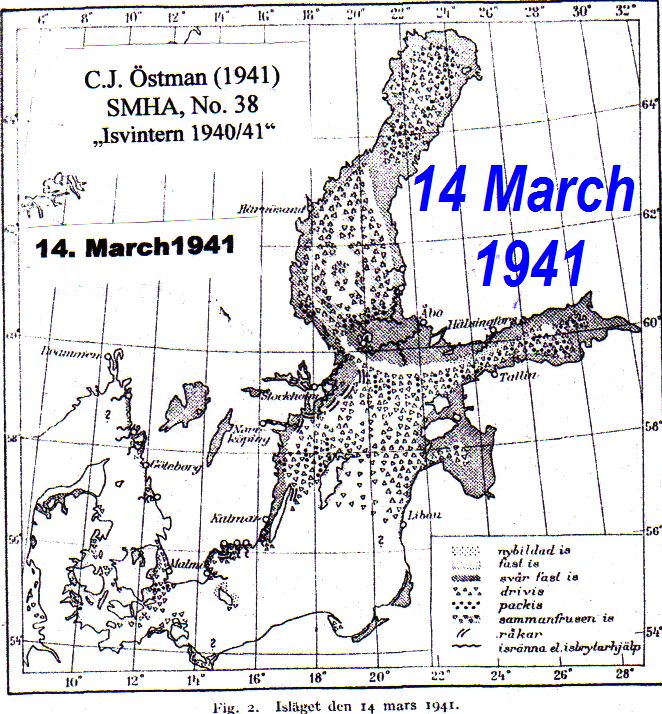
 At the end of his 25 page report he lists the severe winters during which the Swedish coast was entirely
  covered with ice. During the 70 years of regular observations it happened only eight times, five times between 1870/71 and 1892/93, and during the winter 1916/17, 1923/24 and 1939/40. A detailed analysis is HERE.

 What more does climate science need to investigate the role of man in the current warming of Europe’s winter, respectively the sudden and extraordinary cooling during the winters 1939/40. The sea-ice conditions would be an interesting part in any serious
  considerations.


 ocean, its low mean temperature (merely + 4°C), and its overriding impact on the global weather/climate system? Any
 needs only to take an assessment by the IPCC (2013) more serious, whereby “Ocean warming dominates the total energy change inventory, accounting for roughly 93% on average from 1971 to 2010 (high confidence)”, while concluding that the “Warming of the atmosphere makes up the remaining 1%.”


 There is first of all the oceanic water volume versus those in the air. One estimate of the volume of water in the atmosphere at any one time is about 3,100 cubic miles (mi3) or 12,900 cubic kilometers (km3). That is only about 0.001 percent of the total Earth’s water volume of about 332,500,000 mi3 (1,385,000,000 km3. If all of the water in the atmosphere
  rained down at once, it would only cover the globe to a depth of 2.5 centimeters, about 1 inch. MORE


 climate change is a “hoax” anymore, but he made clear that he still doubts whether humans are driving the phenomenon and thinks the whole thing could reverse itself. He used an interview (with CBS ) “to suggest scientists with “a very big political agenda” have fanned concerns about the phenomenon”. Is this about faith against science? The topic receives more and more attention. Meanwhile it is discussed as “Religious Identity, Beliefs, and Views about Climate Change” (Sonya Sachdeva, Sept./2018), or more recently David DeSteno in The New York Times (Feb.01), considering “What science can learn from religion”.
 H.H. Lamb, Meteorological Office Bracknell, Berkshire (UK), “The New Look of Climatology”, NATURE, Vol. 223, September 20, 1969,

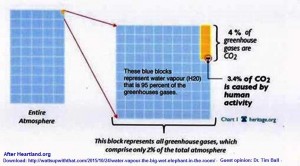 There are first of all the water volume. There is always water in the atmosphere. One estimate of the volume of water in the atmosphere at any time is about 3,100 cubic miles (mi3) or 12,900 cubic kilometers (km3). That is only about 0.001 percent of the total Earth’s water volume of about 332,500,000 mi3 (1,385,000,000 km3. If all of the water in the atmosphere rained down at once, it would only cover the globe to a depth of 2.5 centimeters, about 1 inch. MORE
 making dominance does not end here, but needs to include the mean ocean temperature of just plus 4° Celsius. A fair assessment can only come to the conclusion that the global warming issue, as far as only based on calculating the role of carbon dioxide and methane, is mere speculation. Insisting on such speculation is reckless, pseudoscience, alarmism, and propaganda.
 Temperature contrast throughout the Northern Hemisphere is obvious, as indicated in the Figure to the right. There is today (01/30/19) atypical chill over large swaths of the US Northeast and Midwest. The Siberian cold is
  restricted to Siberia, but central Europe is significantly warmer as common at the end of January. Through December and January, low-pressure cyclones faced little resistance from high pressure fields from the Far East. Even now at the end of January, one cyclone is over the northern Baltic Sea, four more battle eastwards, ensuring that Siberian air do not reach the North Atlantic at Europe’s western shores. But while the Atlantic cyclones push eastwards, the Siberian cold moves eastwards either, presumably contribute to the chill over large region of the United States.


 contributed, and whether the warmer air conditions in Europe where at least partly related to human activities at sea, particularly by shipping, fishing, offshore wind farms, oil-drilling and so on. Fact is that the seawater temperature rise stronger in Europe’s regional and coastal seas as elsewhere. That could means, that Atlantic cyclones are more resistant on their way eastwards, and can either ‘supersede’ cold high-pressure, or push such air further eastwards. Which occurs in winter 2015 and the NOAA called it the “Siberian Express” (see Fig. below).

 Europe is not the world. However Western Europe is under the influence of the weather system from West to East.
  Atlantic low pressure areas move east, unless cold continental high pressure air blocks them. These are the winters that Europe talks about. This succeeds very well when the North Sea and Baltic do not assist the Atlantic weather because they cannot release enough heat or are hindered by sea icing. During last winter 2014/15 they served as perfect helpers and kept the cold from Siberia at a safe distance.


 contributes to the global picture. In the case of N-Europe it may be more significant as weather can be divided in maritime and continental influence, and due to the global air circulation from West to East, it is a gate. It may support the flow of warm wet air eastward (low pressure), or stem it by dry and cold continental air (high pressure), by diverting low pressure areas– in extreme circumstances – towards the Bering Sea or Mediterranean. In so far the North Sea and Baltic play a crucial role in how to open or close this gate.


 that has not yet lead to a sufficient conclusion, as none of them can be regarded as a driver in climatic matters….. Cont.//


 If SST rise in the North Sea more than elsewhere (section 2) and human activities rise as well, the influence on the temperature profile Fig. 4-8 is a serious issue. During summer more heat is pushed down, but available for release during the winter season. The down push is a merrily mechanical exercise, while the interaction between the sea surface and the atmosphere is a highly complex matter requiring certain conditions. Thus it is easier to force heat mechanically into the sea body, while it takes some time until ‘natural processes’ release the ‘additional’ heat according the laws of physics. …. Cont//

 SST can easily change from zero to several plus degrees. Very critical is the impact of vessels navigating in ice-fields, when the water body is cut-off from interaction with the atmosphere. As warmer water is less heavy, as colder water any vessel’s wake spreads below the ice bottom. Although sea ice mechanism and duration is intensively observed and studied
  in the Baltic Sea since the nineteenth century [8] the impact by human activities in the marine environment received hardly any attention…. Cont//
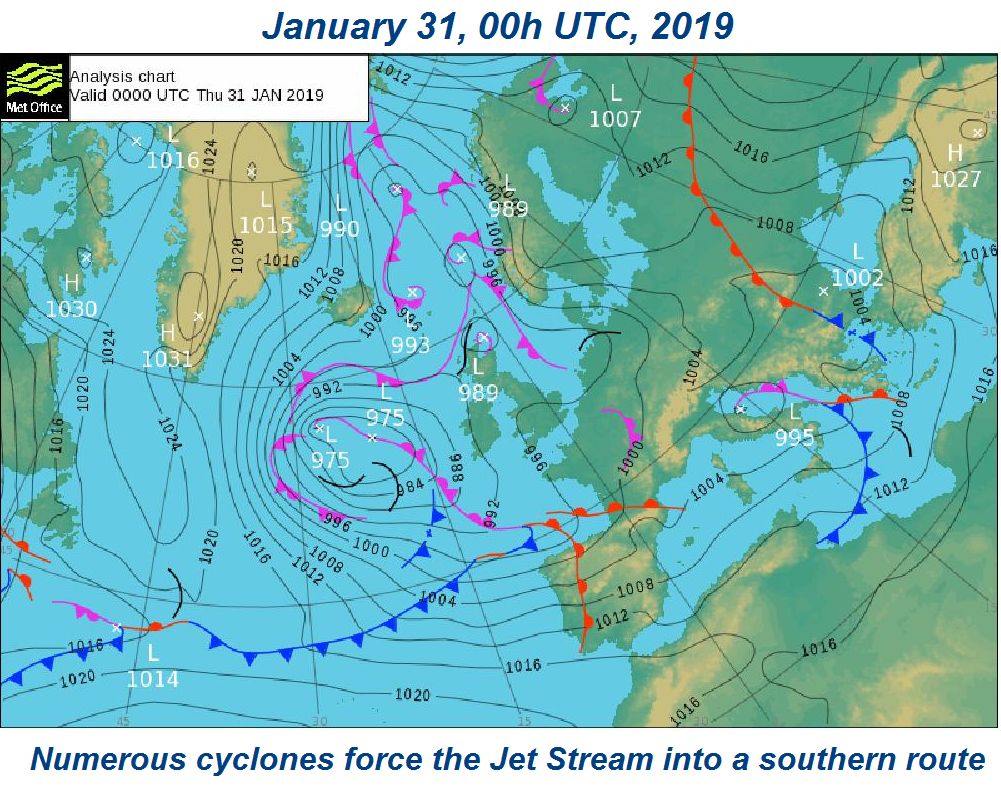


 debunking the solar-cycle – North Atlantic winter weather connection. The paper focuses on 11 years cycles. While it is common knowledge that the NAO usually fluctuates over a period of a few years and has a huge effect on European weather, exactly what causes these long-term patterns, however, it remains unclear. Is it an external force, or an internal ocean affair, as mentioned in the last post about ocean warming?


 atmosphere, or can be partly be attributed to solar cycles. The former is by far the majority of scientists, represented by the Intergovernmental Panel on Climate Change (IPCC), while there are not only few saying that there is “proven by thousands of temperature datasets, the earth’s climate fluctuated cyclically in the past, and there’s an overwhelming body of evidence showing a close correlation with solar activity and other powerful natural factors.”


 reached its first heights with the start of the Second World War (WWII). Suddenly, the weather in Europe runs amok. Eight decades later science has failed to explain to the general public what was all about, and whether a link to the huge military activities can be excluded for sure. How can anyone claim to understand
 climatic changes, if incapable to understand and explain one of the most pronounced and sudden winter weather shifts in some regions during the last 150 to 200 years, which occurred without an ‘obvious’ reason (e.g. earthquake, volcano). Therefore the European weather drama in January 1940 should serve as a reminder that climatologists behaves irresponsible as long as they ignore this drama. Towards the end of January 1940, also the United Kingdom faced the worst possible weather conditions possible, here is a brief account
 encased in glass, trees looked like frozen waterfalls, and the ice weighed them down until they broke and smashed to
  the ground. (pay-wall:The Times, 2007)


 On the 26th, two occlusions were moving up from the SW engaged the cold air over the UK. At the same time, the anticyclone over Scandinavia was intensifying blocking the fronts from pushing through the UK, they became stationary over Wales and SW England. This resulted in a great snowstorm across many northern and eastern areas.
 29th of January.

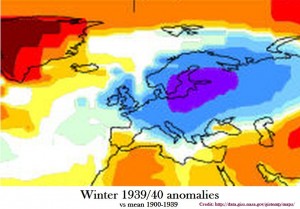 temperatures of between -2 and -4C. The effect of this prolonged ice storm was severe and damaging. Many telegraph poles and wires were snapped, unable to cope with the weight of the ice. Flora
  and fauna suffered as well, many tree branches were snapped off by the enormous weight of ice, birds were unable to fly because ice accumulated on their wings. Travel was next to impossible as roads and pavements became skating rinks. Any sloped surface was impossible to climb. (Credit: http://www.theweatheroutlook.com)
 Further reading: Records, Records, Records – Introduction to the unexpected
 In the following compare a report on weather in the current week (italic green) and early January 1940, which until now
  are ignored, although from 11-21 January five all-time records occurred- See Figure 1.

 What a difference to the weather conditions Europe experienced eight decades ago already in early in January 1940, as shown by an excerpt from [ http://www.seaclimate.com/c/c7/c7.html ]:

 Woudrichem to Heusden.

 The events described and the data clearly indicate that random processes are eliminated there. Why was
  Northern and Central Europe so badly affected? Southern Europe, including Switzerland , however, was much less affected from the Arctic temperatures simply because they didn’t have naval warfare at their front door, ……

 italic and blue. At the moment there are little indication that this is more than a loose guess. Presumably Met Office could have been better, if they –and climatology as well – had started an in-depth investigation on what has happened after merely four months war activities. Suddenly Europe had been plunged in the coldest winter for more than 100 years. Already January 1940 was extreme Fig.1 [and HERE]. From many dozen news-paper report, we reproduce an excerpt from The New York Times,
  on January 21 January 27, 1940 and , with temperatures reported by NYT are in Fahrenheit, in italic and purple. The text is from the Book “Climate Change & Naval War”:

 Result: One of the coldest weather in half a century. In Mos-cow the temperature dropped on Wednesday (January 17) to 49 degrees below zero Fahrenheit (-45°C), in parts of Finland to 58 below zero. Such temperatures can be measured only on alcohol thermometers, as mercury freezes solid at 38 below. (NYT, 21 January 1940; Weekend in Review, ‘War in the Cold’).
 Censorship commenced with the start of WWII. Weather was given a top-secret place. Only when Britain plunged into glacial conditions, not experienced for many decades, His Majesty’s Censor relaxed censorship on weather reporting and The New York Times was able to report as follows (excerpts):
 dispatches – providing the weather news is more than fifteen days old. The weather has been so unusually Arctic that by reaction the censors’ hearts were thawed enough to permit disclosure of the fact that this region shivered since past several weeks in the coldest spell since 1894, with the mercury dropping almost to zero and a damp knife-edged wind piercing the marrow. While British newspaper readers’ teeth chattered, the newspapers told them about a cold wave sweeping Europe, with sub-zero temperature records in Germany, Finland and neutral countries.”
 There have been many headlines in recent days proclaiming a return of the ‘Beast from the East’ and ‘triple polar vortex to trigger heavy snow’ with bookies reportedly cutting the odds that this month will end as the coldest January on record following a sudden stratospheric warming high above the Arctic.
 December 2018 and the winds at around 30 km above the North Pole have now reversed from westerly to easterly. At ground level we know that sudden stratospheric warming tend to weaken the UK’s prevailing mild westerly winds, increasing the chances of us seeing colder weather a couple of weeks after a sudden stratospheric warming.
 Our current 6-30 day forecast points to the likelihood of more mobile conditions before the arrival of anything that might potentially be colder. Towards the end of January, however, there is an increased likelihood of a change to much colder weather generally, bringing an enhanced risk of frost, fog and snow.
 in December 1939. Due to Second World War Europe was in turmoil since 1st September 1939. Several highly extreme weather conditions had already occurred. During the closing days further ‘surprising’ weather conditions showed up the Barents Sea down to the Mediterranean, extreme low temperatures, extreme high air pressure, exceptional snow, culminating in a very destructive earthquake in Turkey on December 27th, 1939. It followed a rare tsunami in the Black Sea, with further weather implications, as summarized in a CHRONICAL (below). By the end of December 1939 to general weather condition in Europe including the
  entire Erzincan earthquake offer a huge set of information on “how weather works” under extraordinary conditions, that one can only wonder why science has shown no interest in understanding and explaining the situation almost eight decades ago.
 through the middle of the continent, were available in the first half of December 1939 itself. Most significant deviation from the average weather became visible just a week before the earthquake struck. Between 21st and 22nd, temperatures dropped to below minus 30°C in Finland north of the Arctic Circle.
 reporting job under the prevailing difficult conditions. While the NYT even became almost philosophical in its comments on December 29, about geology, the meteorological impact of the quake is highly interesting for practical purposes as well. Did the quake and its meteorological side effects contribute to the emergence of the extremely cold war winter of 1939/40 in North Europe?
 December). At the coast the temperatures dropped to 15°C below zero. The storm in Bucharest caused considerable damage. (Hamburger Anzeiger, 23/24 December 1939). Snow also fell all over Bulgaria on December 21-22, starting a new cold weather episode (down to -16°C); on December 24th in Northern Bulgaria -20°C; December 25th until the earth quake in Turkey on 27th more moderate temperature below zero, showing no specific weather anomalies, (according to the Bulgarian newspaper ‘Zora’; by personal communication).

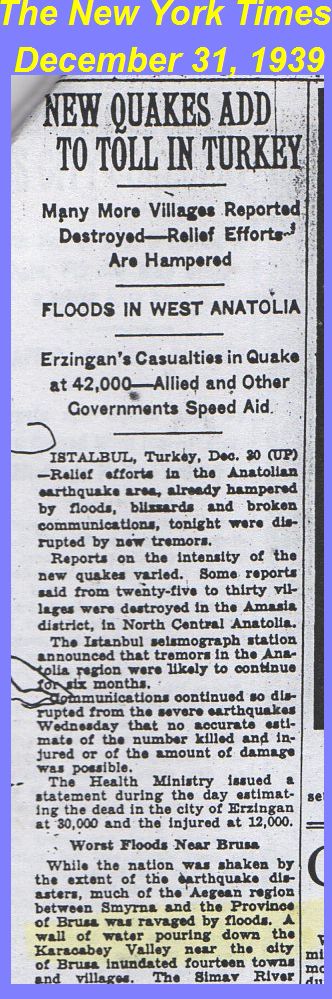


 implementation of the Paris Agreement on climate change (adopted in December 2015). In Katowice, Poland,
  the Parties are aiming to finalize a detailed set of rules and guidelines – the so-called Paris ‘work programme’ or ‘rule book’ from 2-14 December – which will enable the landmark accord to be put into practice all around the world. Particular is the monetary aspect, namely the promise to raise $100 billion a year, from both public and private sources, by 2020 to help developing countries address climate change. The sum is mind-boggling, and the complete ignorance to simple historical events – for example the arctic winter in Europe 1919/40 – is shocking and dangerous.

 Christmas Eve in Finland will be presented at the end of the post, as the climatic drama first culminated in January 1940, but continued well until mid-February, which is thoroughly discussed in numerous book chapter, online HERE & HERE.
 Under such circumstances it is highly ignorant and gross negligent to talk about climate change in Katowice, although human activities may have cause, or highly contributed to record cold temperatures in winter 1940. The ignorance is particularly annoying, as the mechanism which lead to the rampage of climate can be easily attributed to the warmonger Adolf Hitler, who started WWII and this inigiated that huge naval force crisscrossed the sea, and churned and turned the sea up-side-down by shelling, mining, torpedoing, and bombing. The immediate consequences are easily explained by a daily exercise:
 Too warm water in the baby-tube in cooled down by churning the water with the hand around. The North and Baltic Sea are like the baby-tube, warned during the summer season. If forcefully churned in autumn and early winter, any stored heat diminishes quickly, opening the way for cold air in anti-cyclones (high-pressure) to move frm Siberia westwards up the shores of the North-Atlantic, denying low pressure cyclones to travel straight eastwards, directing them either to the Barents Sea or South to the Mediterranean Sea.
 whole climate change debate in a complete different direction. Evidence would be on the table that man is able to a moderst winter scenario into a disaster within a few months. One mad-man as Adolf Hitler is enough to cause the coldest winter in Europe over more than a century. The Katowice climate summit is bringing together around 30 000 delegates from almost 200 countries, top state officials, representatives of business and NGOs among them, but without the competence and interest to answer a fairly simple question: What cause the sudden climatic change in winter 1939/40? Which atmospheric condition caused the all-time cold record in the village Siedlce on 11th January 1940 and several other locations? What caused the full ice-cover of the Baltic Sea after more than 40 years? What caused the extraordinary Christmas Story narrated by a reporter from the New York Times (extract), which goes at it follows:
 battling in blinding snowstorms for possession of ice-covered forests. …I reached the spot just after the battle ended. It was the most horrible sight I had ever seen. As if the men had been suddenly turned to wax, there were two or three thousand Russians and a few Finns, all frozen in fighting attitudes. Some were locked together, their bayonets within each other’s bodies; some were frozen in half-standing positions; some were crouching with their arms crooked, holding the hand grenades they were throwing; some were lying with their rifles shouldered, their legs apart….Their fear was registered on the frozen faces. Their bodies were like statues of men throwing all their muscles and strength into some work, but the faces recorded something between bewilderment and horror”.

 For 79 years a rich set of weather data is available. The war parties collected them abundantly. The proofed
  easily that the German Reichkanzeler could have trailed and convicted as the first climate-change criminal. But climate science is not interested. They consume billions and billions in research a possible CO2 menace, ignoring the realistic threat by human activities in the marine environment. Presumably the biggest disaster concerning anthropogenic climate change matters.


 Climate and a Three-Dimensional Atmosphere.” by Dr. Tim Ball at WUWT on 04 Nov 2018. The assessment by Tim Ball that for to many people the earth is still flat, is a good start to discuss deficiencies in climate change matters. Focusing merely on the atmosphere, is a much to narrow view: “they look at weather maps but are unable to visualize the 3-D atmosphere.” But is this view not also too much restrictive? Is not the ocean the media which makes climate? Here at www.oceansgorvernclimate.com we think the discussion should be considerable wider, as all what concerns about weather and climate is primarily a water question. This issue was already prominent, long ago, by Leonardo da Vinci (1452 -1519).
 Leonardo da Vinci’s musings on the nature of the world and what makes it tick is shown in the exhibition “Water as Microscope of Nature: Leonardo da Vinci’s ‘Codex Leicester,’ ” at the Uffizi Gallery in Florence since 30th October last week. He was convinced that the science of waters would enable him to reveal the organization and functioning of nature. The exhibition offers many hindsight how he viewed: water. Famous is his saying: Water is the driving force of all nature. And that brings in the term climate.
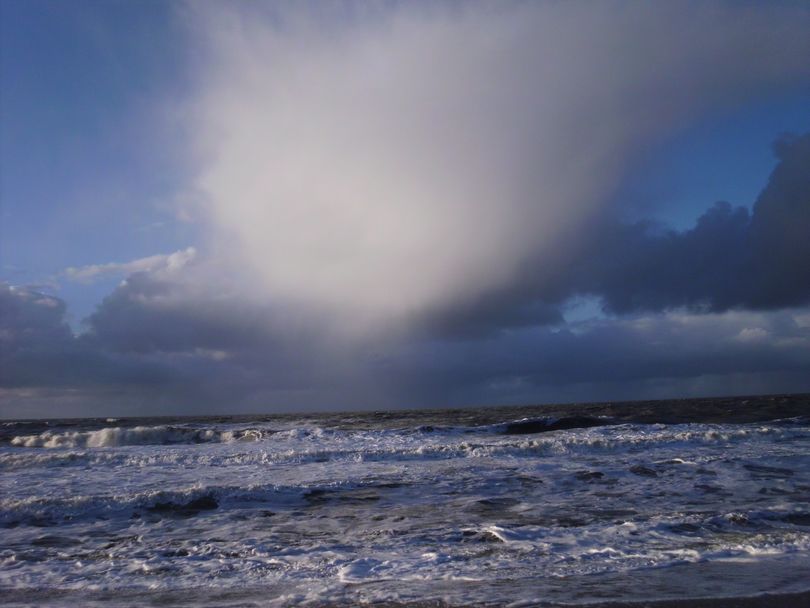
 essay (above) Tim Ball merely offers this explanation:
 As a reminder, the subject is about global air temperature, and whether they increase globally. Air temperatures are part of local and global weather, but they are not weather. Temperatures are numbers or indicate more warm or more cold. By IPCC definition (Glossary 2018):
 form of heat.
 It sounds though when a speaker announces: “This lecture attempts to force the scientists in the audience to come to grips with the actual nature of the climate system”. Indeed one should wonder when someone is talking about the “actual nature of the climate system”, without telling in the first place, how he would like to define the term, as those commonly used are of little help. But let’s start with the recent lecture.
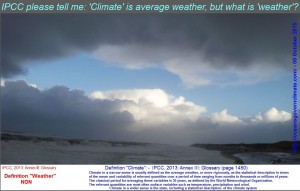
 Would anyone object if someone would regard that as: “Natural system” means the totality of the atmosphere, hydrosphere, biosphere and geosphere and their interactions. According common definition: Nature is the phenomena of the physical world collectively, including plants, animals, the landscape, and other features and products of the earth. It seems difficult to detect a difference to a climate system. However, both refer to the world of physics.
 Much of the popular literature (on both sides of the climate debate) assumes that all changes must be driven by some external factor. Of course, the climate system is driven by the sun, but even if the solar forcing were constant, the climate would still vary.
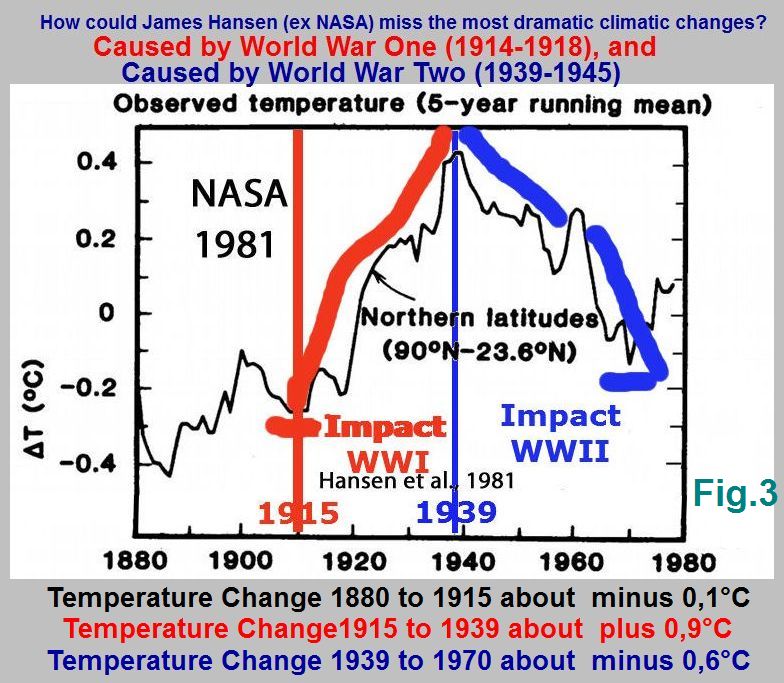 most of the global warming that has been observed since the latter part of the 19th century.15 I hypothesize that shorter multi-decadal changes in the MOC16 are responsible for the more recent global warming periods between 1910–1940 and 1975–1998 and the global warming hiatus periods between 1945–1975 and 2000–2013.
 started to make the first connections between sea-surface temperatures and the atmospheric circulation (The Independent, 1997). He was also the one who observed in 1969 that “Only thirty years ago climatology was generally regarded as the mere dry-as-dust bookkeeping end of meteorology (NATURE). It seems little has
 Talking the Same Language” (WUWT, 23 Sept.2018) Although he touches the problem frequently (e.g. WUWT, 28 May 2018) he misses the crucial point to understand climate change and what human kind is contributing – the role of the oceans.
 climate models. Those produce scrap if not fed with ocean data, which at best exist only randomly. Sceptics fail to make this their main argument.
 observation network of infinitive resolution, and run on an infinitely powerful computer, should in principle produce a perfect forecast with an unlimited range of validity”.


 Early Holocene that was triggered by the glacial drainage of freshwater into the North Atlantic and is recorded in multiple climatic archives across the globe. Frequently this side discussed substantial man-made weather and climatic changes during the two World Wars 1914-1918 and 1939-1945 (for 1939/40 see Fig. 3), MORE; and is convinced – based on strong facts – that shipping and other ocean uses by man has significantly contributed to global warming during the last 150 years (Fig. 5, 6), more HERE.
 Now 16 eminent scientists published a study in the Proceedings of the National Academy of Science – PNAS August 6, 2018 – titled: “Trajectories of the Earth System in the Anthropocene” mentioning the ocean and seas -except as CO2 sink – not with one word. Instead they talk big about our planet at risk of heading towards an irreversible “Hothouse Earth” state. The abstract opens with the statement
 the threshold would lead to a much higher global average temperature than any interglacial in the past 1.2 million years and to sea levels significantly higher than at any time in the Holocene.
 time soon.
 Not less shocking is the observation that the study by the team of 16 international scientists (Will Steffen, et al.) was merely dismissed partly for “that there was no new science here”, but not therefore that the highly evident impact of the ocean is entirely ignored (see above). Even such highly attentive critics as Prof. Judith Curry, seems far away of addressing the serious deficiencies of the study, merely remarking in her post at (excerpts from “JC reflections”)
 If the paper wasn’t so heavy on the policy prescriptions, it would be a much more credible contribution. //cont.
 requires immediate recognition of the major role of the huge and extreme cold water masse contained in the oceans and sea concerning weather and climatic matter, and profound and thorough research about the historic events (e.g. naval war changed climate), present (shipping, fishing and other ocean uses) and future human ocean activities that may influence climate change.
 Back in 1984 Carl Wunsch discussed the matter already lengthy in: ”The Global Climate”, ed. John T. Houghton, Cambridge p.189-203). He raises a number of topics, saying for example: “The role of the ocean in climate and climate change is unlikely to be demonstrated and understood until observations become meaningful in terms of physics being tested” (p.189); and “There is no substitute for adequate data”, (p.200).
 Review, 2010, p. 1960-1967). Almost a decade late the paper surfaced due to Prof. Judith Curry while doing a literature survey for a paper on Climate Uncertainty and Risk. As she regarded the paper by the esteemed oceanographer for a fascinating perspective on paleo-oceanography and paleoclimatology, she used it for a post on her blog Climate Etc.; titled: ”The perils of ‘near-tabloid science’” on July 22, 2018. Unfortunately she chooses a one-sided approach by selecting only excerpts of relevance to the sociology of climate science. The oceanic part is completely neglected, although the Wunsch paper expresses the view understanding the dynamics and physics of the ocean is a perquisite for predicting future climate. Merely concentration on the sociology of climate science indicates to the fundamental problems in the climate change debate is distracting from the core issue of climate: the oceans. One need only to read the comments to Curry’s post at Climate Etc. & WUWT. The ocean issue is not discussed.
 and so I will here take as a not-untypical example, the hypothesis that the North Atlantic circulation largely controls the climate system, and in particular, the notion that the surface salinity is the determining influence.
 In his previous essay “OBSERVATIONAL NETWORK DESIGN FOR CLIMATE”, 2009, the list of requirements is even more detailed (excerpts):
 system. (5) ….

 Discussing big climate changes in a similar context is by far not new, with little avail. Too remote is overriding influence of the ocean on any change taken into account. Due to its cheer size low average temperature of mere +4°C, and variation in salinity, its relevance in the climatic system is 1’000 times bigger than of the atmosphere. A comparable very small water body of meltwater, cold and salt free, can easily trigger a very substantial drop of air temperature and an ice age. If the mentioned research concludes that melting water was “most probably the trigger” for the Younger Dryas cooling, it avoids discussing the ocean issue. Why? Is it a too big issue? Are too little data available? What could be done to overcome this problem?

 Dryas cold event?” , respectively Xu Zhang, 2014 “Has the puzzle of rapid climate change in the last ice age been solved?” Both mention remotely a slowing of Atlantic circulation, but remain far away from linking the periods of ice ages to the overriding structure of the oceans that can easily be triggered by numerous causes climatic changes, for example: meltwater, earthquakes, meteorites and so on. That is difficulty to assess after ten thousand, several hundred thousand or millions years, as ocean circulation is changing, leaving no direct record.

 Does that prevent progress on understanding the impact of the ocean structure on climate change? It does not! Science need
  not more to do than investigate the impact of ocean activities at and in the sea. Shipping, fishing, off-shore industry, and other activities have an immediate profound effect on the temperature and salinity structure in the upper sea surface level. Those are not peanuts if one has to talk about many 100 Millions of nautical miles per day. Down to 10 meters the sea surface is mixed, leaving a wake that changed the temperature and salinity structure. Science does not even see that this is a serious contribution to global warming over the last century.

 course over few decades. Science needs only to pick up the challenge to explain the global warming after WWI and the global cooling from about 1940 to the mid-1970s. (more HERE) That research would enable science for better understanding historical drastic temperature jumps, but also understand urgently that


 human generated carbon dioxide (CO2) is warming the world and causing climate change since the 1980s. Fixed to this issue they are presumably the ultimate threat to a water planet as this earth. Any possible anthropogenic impact on the oceans and subsequently the weather and climate should be a major issue, which requires that all possible mechanism must be understood thoroughly. The current scientific community is fixed on the atmosphere, including sun and volcanoes, but considers the sea too remotely. That is dangerous! The oceans-govern-climate!
 It is extremely rare to hear a voice that emphasizes the connection between water and climate
  as a prerequisite for understanding climate changes. In a recent post concerning fundamental climatic changes over geological periods WIM RÖST (WUWT – 15.June) asserts that all changes were due to water, which determines the ‘General Background Temperature’ for the Earth, resulting in Hothouse and Ice House Climate States. Interesting is his assessment that “the temperature of the deep ocean is the main factor. Deep-ocean temperatures from -1 to +3 degrees Celsius, as we have now, keep the Earth in an Ice House State. Slightly warmer deep-oceans with temperatures from 6 to 10 degrees Celsius* bring the Earth to a Warm House or a Hot House Climate State.”

 More to the point of understanding the link ocean-climate today is Joe Bastardi in a post of 14. June 2018 : “More Evidence Water Vapor Is The Big Climate Kahuna”, by accentuating that:
 The question should instead be based on the current ocean structure and physical mechanism. What impacts have the various human marine activities from shipping, and fishing to off-shore installations? Any activity may warm or cool the sea surface, which immediate or long term impact on the state of the atmosphere. After all the sea-surface temperatures (SST) are only warm in a very thin layer, while the ocean total average is only about +4° Celsius. Was the global cooling from 1940 to 1970 caused by WWII? Screw driven vessels are likely to have contributed to warming the SST over more than 100 years. Sub-surface activities, as off shore industry, fishing and naval wars , affect the vertical temperature and salinity structure over considerable water depths. Neither Wim Röst nor Joe Bastardi have any clue about anthropogenic ocean change, although Wim Röst gets the general view right:
 the core message of an essay by Professor Sybren Drijfhout from Southhampton University: The relation between natural variations in ocean heat uptake and global mean surface temperature anomalies in CMIP5 ; is published on 9th May 2018 in Nature Scientific Reports. It says: “New research has shown that natural variations in global mean temperature are always forced by changes in heat release and heat uptake by the oceans, in particular the heat release associated with evaporation“.
 Talking about the warming of the oceans, should not only be subject to computer simulation, but should consider possible causes. A major factor is definitely human activities at sea. Shipping, fishing, and off-shore facilities have a huge impact on the sea surface temperature (SST). All screw driven vessels and boats are likely to turn over the upper sea-level on a
  distance of 100 Million kilometers very day. This is a huge potential for warming the oceans. Since motor ships cross the seas, the global temperatures are on the rise, except for the two world-wars related periods. HERE & HERE.

 warming. It sound even naive when he says “these variations are associated with heat transfer due to temperature differences between the surface ocean and the overlying air, and heat transfer associated with evaporation. The heat fluxes are also called the turbulent heat fluxes.” More in a press-release.


 A more in-depth research would have shown that the sudden drop of the annual temperature in 1940 was actually a winter issues. Out of nowhere the winter 1939/40 was the coldest for more than 100 years, as well as the subsequent winter 1940/41 and 1941/42. In so far it is important to realize that the sudden extraordinary weather condition prevailed during the winter seasons. As the influence of the sun diminishes strongly from October to February, it is much easier to investigate the causes. When taking into account that main region of coldness stretched from Great Britain to St. Petersburg and Moscow, respectively covered the North – and Baltic Sea, it is inevitable to consider a decisive link to the huge naval activities in these semi-enclosed waters. They store heat during the summer season, which is released during winter. The more the water is churned by winter of human activities, the quicker the heat is released, diminishing the heating capacity. Cold air from the Arctic or Siberia can establish their reign over Europe up the North Atlantic. That easy was it to plunge the war winter 1939/40 to a record low.
 first WWII winter in Europe could serve as evidence how easy climate can be changed by human activities. Actually it happened in connection with the First World War, and moreover the three decades global cooling from 1940 to mid-1970 is a serious naval war matter.

 respect. They brought themselves to prominence three decades ago, but for them “Climate in a narrow sense is usually defined as the average weather”. It follows a few abstracts from current definitions:
 They not recognize that statistics from months to millions of years do not explain anything,
  __relevant quantities are most often surface variables such as temperature, precipitation and wind
 observations
 ___ Physical, chemical, and biological processes are involved in the interactions among the components of the climate system.

 AGW opponents are talking about. Ever since, for them is the ocean only a random issue. For example they tell the Court:
 other causes, like changes in the sun or volcanos. That’s the natural forcing.
 a huge impact on the atmosphere and drives average air temperatures. The fact that an El Niño is a significant event, tells nothing about how the ocean contributes to warming and cooling. Telling the Judge that “more El Niño events that would add to the overall warming”, is hardily helpful.

 season, cold air from Siberian can reach Europe and establish reign for days or weeks, respectively delay the arrival of spring.
 We now briefly record the current cold snap, as mentioned by weather.com (15/17 March 2018, shortened):
 weekend. “Sunday will be the coldest day with maximum temperatures struggling to lift above freezing across the U.K., Belgium, the Netherlands, Germany, northern France and southern Scandinavia.” Wind chill values may dip as low as minus 10 degrees Celsius – equivalent to the mid-teens Fahrenheit.
 The cold air will work its way south and west into most of the rest of Europe later in the weekend (17/18 March). It is in this part of Europe where the cold will persist the longest well into the week of March 19-23. This pattern will also g
 enerate areas of snow that will persist through much of that week in southern, central and eastern Europe. Some of that snow will be moderate to heavy, not simply in the Alps, but also from parts of Germany and Poland to the Ukraine.
 temperatures on earth. The excellent blog of Judith Curry did it (2018/03/09), while Willis Eschenbach picked up the subject at WUWT. It is worth to read both post,
 It is little Prof. Curry offers herself to contribute on her question where the heat is coming from. Neither does Willies Eschenbach who stress that nobody knows much about the up-and-down since the Romans, but that “ … none of those gradual temperature changes were caused by variations in CO2”. Subsequently he mentions that the sun is the source of all heat, but stress univocal:
 ABSOLUTELY NOT. There are plenty of forces at play in even this restricted subset of climate variables, and the fact that a couple of them line up does NOT mean that one is causing the other.”
 aware of the size of the ocean with a ration to the atmosphere of 1000:1; and is aware that the mean ocean temperature is as low as about 4°C, would not exclude the ocean from any research and accounting of global heat and of global cooling.
 would inevitable show that this contributed to global warming since the end of the LIA considerably. The tonnage has increase in 90 years by 2600% (Fig.5). A much more profound demonstration of man-made climate changes by maritime activities offer the two World Wars; the First (1914-18) by a influencing the Ocean around Svalbard, causing a warming from 1918 to 1940 , and during the Second WW (1939 -1945) revolving so much cold water to the sea surface that the world cooled for three decades. (see Fig. 1, 3 & 6) For details see: http://www.seaclimate.com/ and http://www.2030climate.com/


 Europe’s cold snap inevitable man-made? Watch out!
 the maritime air is, the easier she not
  only gets ‘pulverized’ by the cold and dry air, but opens the path for the ‘Beast from the East’ to travel to the Atlantic shore.


 __Jesper Starn and Rachel Morison at Bloomberg: Cold air flows from Siberia will send temperatures 10 degrees Celsius (18 Fahrenheit) below normal next week, when Germany, France and parts of Britain are expected to get the coldest temperatures this winter, weather forecasters said….. The freezing conditions will last through the first 10 days of March for Britain, the Netherlands, Germany and Scandinavia and could bring heavy snowfall, Dobson
 said.
said.


 other jurists have prepared themselves for this battleground?”, referring to a discussion by Jason Scott Johnson, et al; Global Warming Advocacy Science: A Cross Examination (2010, PDF, 80 p). A very recent defamation case the court showed strength by calling the article “a poorly written opinion piece that offers views on conventional climate science”. The case was dismissed. The clear verdict was released on February 13, 2018, (Judgement ca. 23p) based on the following circumstances. .
 The Supreme Court in British Columbia/Canada had to handle a dispute between a climate warm-monger, Andrew Weaver (plaintiff), and on the other hand a climate skeptic Timothy (Tim) Ball (defendant). Both are Professors and well versed in the climate research field since long. Now the plaintiff required damage for defamation by a Tim Ball article on January 10, 2011, entitled: „Corruption of Climate Science Has Created 30 Lost Years”. (full text: Judgment – Schedule A – p. 20-22).
 his 2011-text emphasise “that he has taught science for the last 30 years”, which means since 1981, he should have realized that all sections of scince is talking about climate but not able to ensure that the use of the word ‘climate’ is based on reasonable scientific definitions. Lamb and Hare (see Figures) stressed that Cliamte used to be a layman’s term.
 proves it again. Whereas North America and Siberia saw record braking freezing temperatures in early 2018 (more), Europe is spared of wintery weather until now (Fig. 1). The most likely reason is increasing ocean use, particularly by off-shore windfarms and shipping, which churn the sea like moving spoon in a hot coffee pot. While climatology is not able to consider this mechanism, any cold from the Arctic or Siberia is kept at bay. That should have been common knowledge since long, at least since the commencing days of World War II.
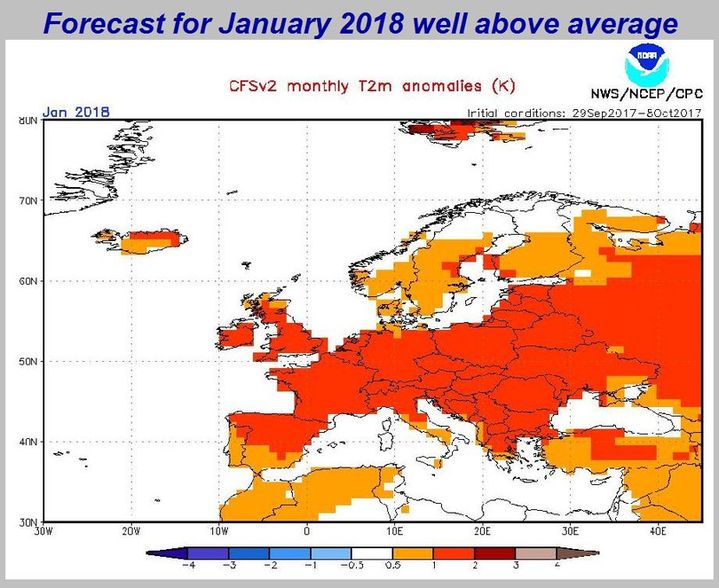
 mines, depth charges, many million shells, and thousands of vessels, navigating, fighting, mine-operation, surveillance, and training. However, the impact on the winter conditions than and today seems contradicting. Winter 1939/40 was in many locations the coldest for up to 200 years or ever recorded, while currently climatology will soon declare Europe’s winter 2017/18 the warmest ever. The tragic is that both cases have the same source, man-made climatic changes, but science does not know, and is unable to inform politics and the general public correctly.
 2017/18 is based on the same physically-dynamic process. The starting point is the intake of heat during the summer season in the reginal seas around Europe, particularly in the North- and Baltic Sea, which will be released during the subsequent winter. This ‘natural’ process is meanwhile greatly enhanced by human activities. The more or the longer the atmosphere gets an extra heat input, the less any Arctic or Siberian cold will get a chance to govern the winter in Europe. But the stored heat is not unlimited. If the available heat is released too quickly, the result reverses. When reginal seas are cooled to ‘unusual levels’, Siberian icy cold air can easily travel to the Atlantic shore. That occurred in winter 1939/40. As an example then and now, see Fig. 4 & 5.


 mid-1970s. Ocean uses in all its facets, is likely to have contributed to the global warming over the last 150 years. The vast installation of hundreds of off-shore windfarms during the last decade is certainly a contributing factor to the higher than the global warming of the seas around Europe. In the North and Baltic Seas temperatures increased five to six times faster than the global average over the past 25 years, and three times faster in the Black and Mediterranean Seas. (Related Essay in PDF) Science spend many billions to prove a correlation between CO2 and global warming, but not one cent on how shipping, fishing industry and naval activities have influenced weather and climate conditions since the end of the Little Ice Age around 1850. Climate science behaves highly irresponsible.


 The terminology climate science use is all but helpful. Is it accidentally or consciously misleading? There is no
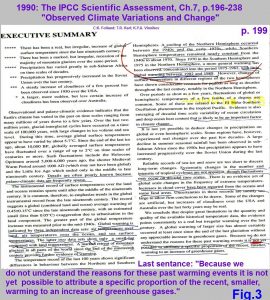 to cause changes in climate and weather.
 problem quickly, readily with the next IPCC Report in 1995. The ‘trick’ is explained by a recent post at “Climate Etc.” (Jan/03/2018) titled “Manufacturing consensus: the early history of the IPCC”. Prof. Judith Curry reviews a book by Bernie Lewis that shows the scientific debate on detection and attribution was effectively quelled by the IPCC Second Assessment Report (1995). Indeed Chapter 8 does not hesitate to establish an initial evidence “of an anthropogenic climate signal – if models are correct” (Fig.5). The entire Chapter 8 Conclusion see Fig 5 & 7.


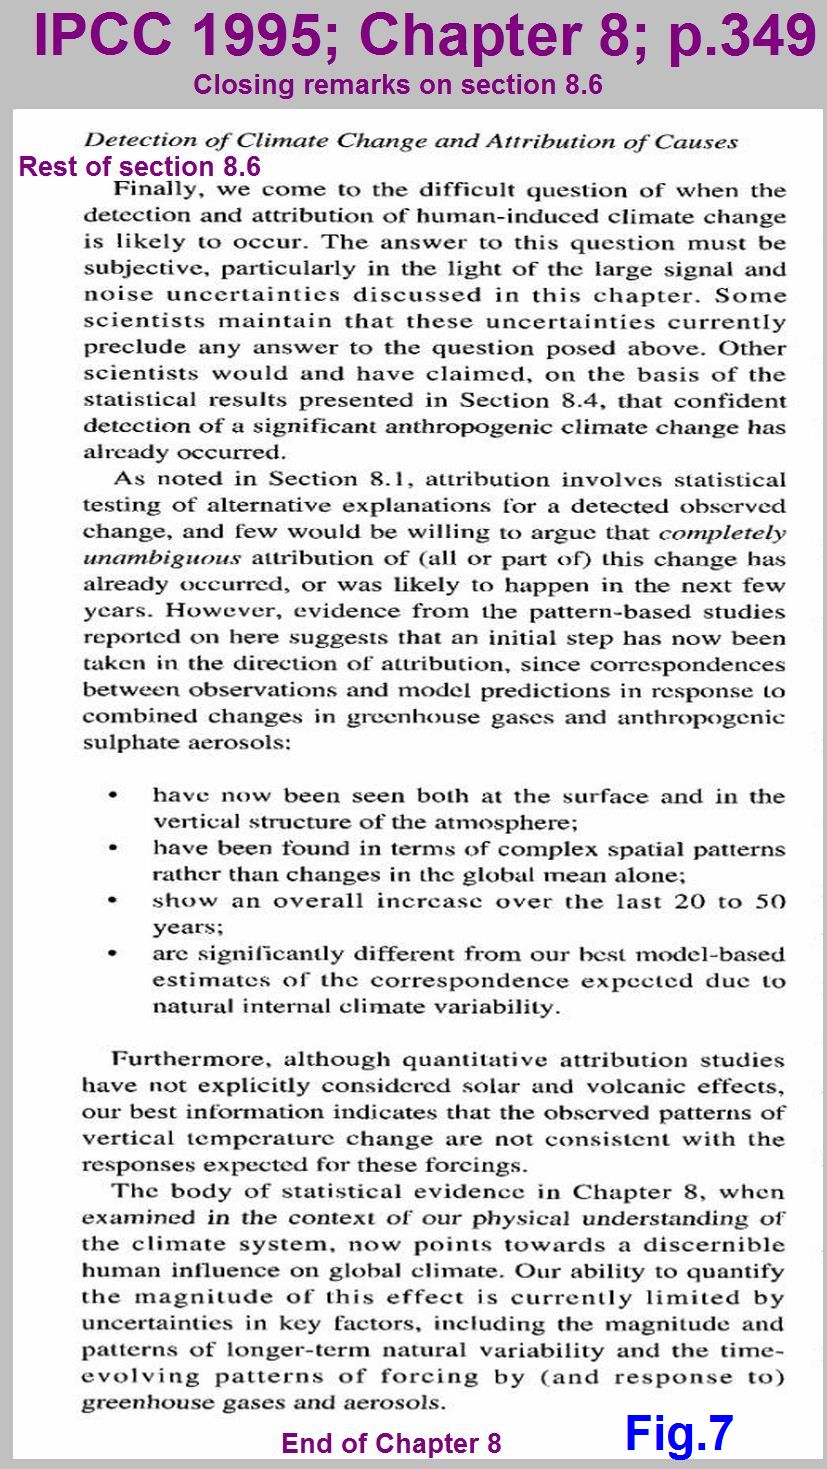

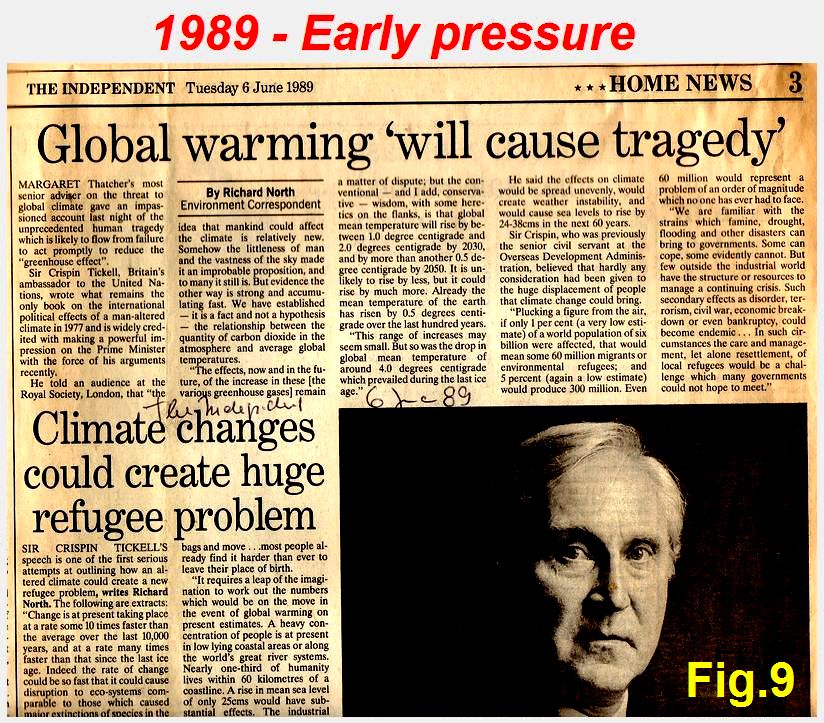

 Celsius. The target is extreme naïve, as long as climate science is not able and willing to analyze and explain what happened to the weather in Europe in the first few months since World War Two (WWII) started September 1st 1939.
 scientist A. J. Drummond expressed his amazement as it follows: “The present century has been marked by such a widespread tendency towards mild winters that the ‘old-fashioned winters’, of which one had heard so much, seemed to have gone forever. The sudden arrival at the end of 1939 of what was to be the beginning of a series of cold winters was therefore all the more surprising”. 70 years have passed and science is completely ignorant on an evidently human interference in weather and climatic conditions due to naval warfare. Talking about warming without understanding cooling by man is suicidal ignorance, and terribly irresponsible.

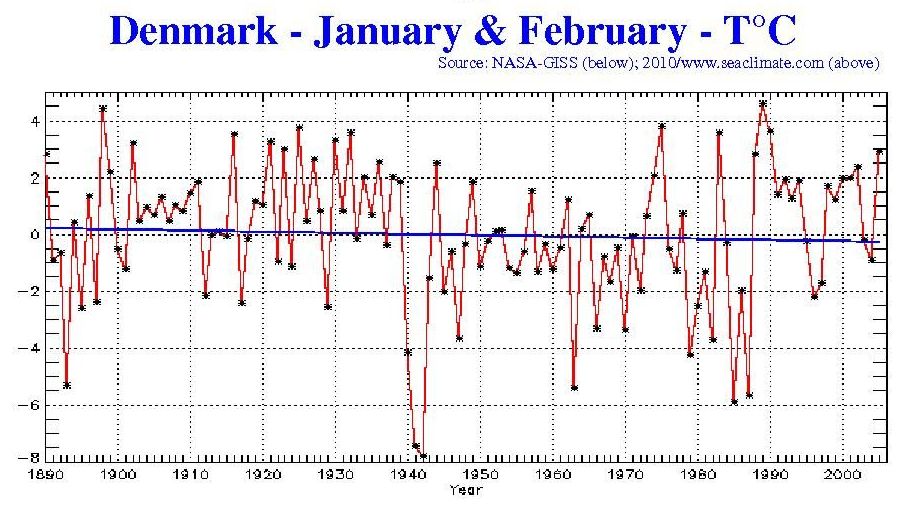


 an average depth of 490 m. While the ocean means temperature account for a mere 4°C, the Rd Sea offers a very different picture. The average surface water temperature during the summer is about 26 °C in the north and 30 °C in the south, with about 2 °C variation during the winter months. The water body temperatures increase to about 27° at the bottom (Fig. 2 & 5). The overall average is 22 °C. As the rainfall is extremely low, averaging six centimeter per year, the Red Sea is one of the saltiest bodies of water in the world, owing to high evaporation, with an average salinity of 40 ‰. Highly remarkable is the uniformity of the water body over all seasons, very different to the North Sea.
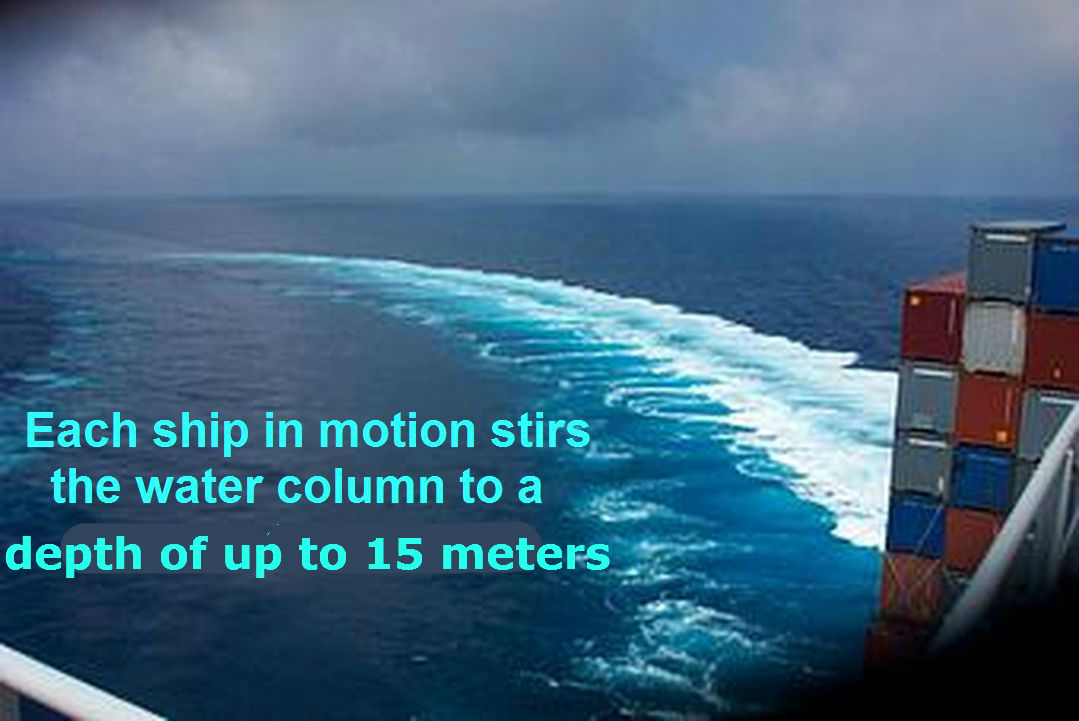


 Now the impact on sea level structure increase further. The world’s first floating wind farm opened on 18 October 2017, off the east coast of Scotland. The 6MW turbines rise 175m above sea level, and extend 78m below the surface of the water, tied to the sea bed by cables. The anchors used to stabilize the turbines stand at 16m and weigh 111 tons. (Details) Inevitable huge water masses of different temperature and salinity will change between the various sea levels. As an example see Fig. 2 (Northern North Sea – Section 1-4). The sea surface will warm or cool and either warm or cool the air temperature above the scene.


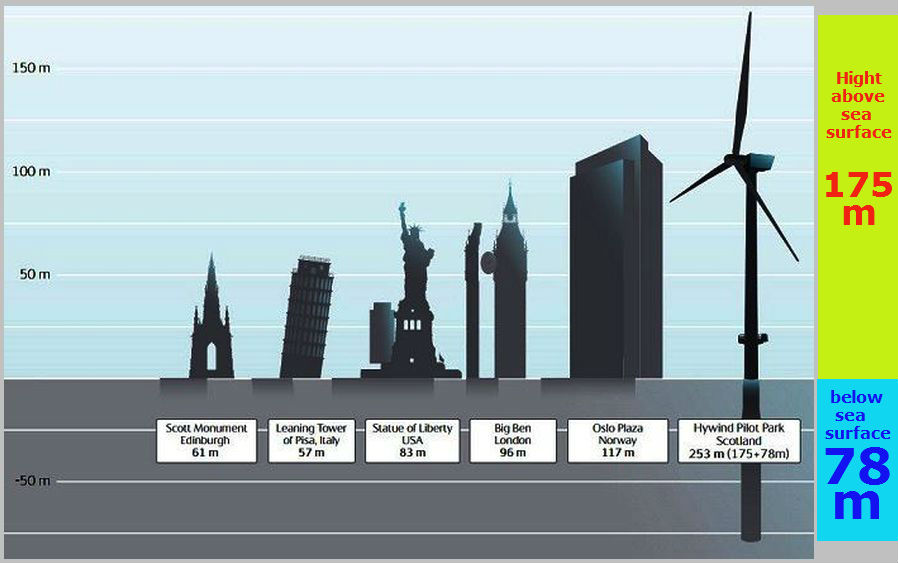
 climate change in a recent NYT Opinion (Fig.1, 12/13 Aug.2017). His conclusion that the ‘tweeter in chief’ and the Republicans rejecting not just scientific evidence but also obvious lived experience, sound good, is true, but unfortunately in no way better as arguments from those he addresses as climate deniers or climate skeptics. They are mere nay-sayers to all scientific efforts in climate matters, or cry loudly hoax as the old Senator Jim Inhofe (R-Okla.).
 To be clear; climate change is real. Climate change means a change in statistics, and climate statistics have permanently changed over the last several 100 million years. They have also changed since global industrialization started about 200 years ago. One eminent question is, to understand and minimize the role of humankind in this scenario; although the far more important question is, in what direction we are heading. Will it be warmer, will it be colder? The latter does not cross Paul Krugman’s mind. He is only able to discuss his points on the global-warming basis, and that is as ignorant as crying HOAX.
 More global warming requires many dozen years. The status of the 4°C warm ocean can shoot the world in a new ice age in few months. More than 95% of our past (Fig. 2) was much, very much colder than our present. A minor shift in this direction is definitely more and quicker destroying civilization as anything else, which we should understand and know pretty soon.

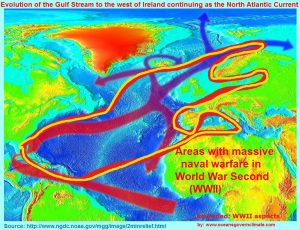 surface temperature changes, which is characterized by two weak slowdowns in the mid-twentieth century and early twenty-first century and two strong accelerations in the early and late twentieth century. But instead of considering the possible impact man’s ocean activities during the last 150 years, they merely acknowledge that “the cooling in the mid-twentieth century and distinct intensity differences between the slowdowns and accelerations remain unclear” (Nature, 2017).
 While it is challenging to assess the impact of screw driven boats and vessels on the sea surface temperature, two of the four temperature shifts mentioned by Shuai-Lei Yao are strongly connected to the two World Wars, namely 1914-1918, which contributed to a global warming from 1918-1939 and 1939-1940, which may have caused a global cooling from 1940 to 1970. These two events penetrated the sea in a much more intensive manner as peacetime shipping and fishing would do. Even the scenarios between WWI and WWII are very different, but the difference is useful to demonstrate the correlation to the climatic shifts in question.
 Ocean. (More HERE)
 from the heat store during the summer much earlier than usually. The more serious impact on climate came with ocean wide naval activities. The ocean movements are highly sensitive to temperature and salinity structure. Only the most upper sea surface level sustains modest global air temperatures. Lower levels of a few dozen meters are colder, and the entire ocean with an average depth of about 3’300 meters is only +4° Celsius warm. Naval war penetrated the sea down to the bottom of the sea, which could be 10’000 meters.
 merely a long-standing mystery. When Marius Årthun et al (June 2017) observe that “the North Atlantic is the key provider of a predictable northern climate” they should extent their interest in the impact of human ocean activities. Even the newly appointed U.S. Energy Secretary Rick Perry considers ocean waters as control knob in climatic matters (CNBC-interview). At least some progress is made toward acknowledging that climate prediction resides in the ocean.


 On the other hand the EEA [European Environment Agency] observed (Fig. 1): Over the past 25 years the rate of increase in sea surface temperature in all European seas has been about 10 times faster than the average rate of increase during the past century. In five European seas the warming occurs even more rapidly. In the North and Baltic Seas temperature rose five to six times faster than the global average over the past 25 years, and three times faster in the Black and Mediterranean Seas. ( see: EEA-update 2015). Those are facts that must not be ignored (see PDF from: Journal of Shipping and Ocean Engineering ; Volume 7, 2016 and Box below).
 the reduction in cloud cover.” That is hardly more informative as van Oldenborgh concluded back in 2009: ‘climate predictions for western Europe probably underestimate the effects of anthropogenic climate change’. Many dozen papers have been published ever since on the summer warming (see B-W. Dong), improving little.


 n the debate over the last few decades, at least does not receive the observation and research investment, this vast weather and climate-machine requires. Back in 1942 H.U. Sverdrup told meteorologists that:


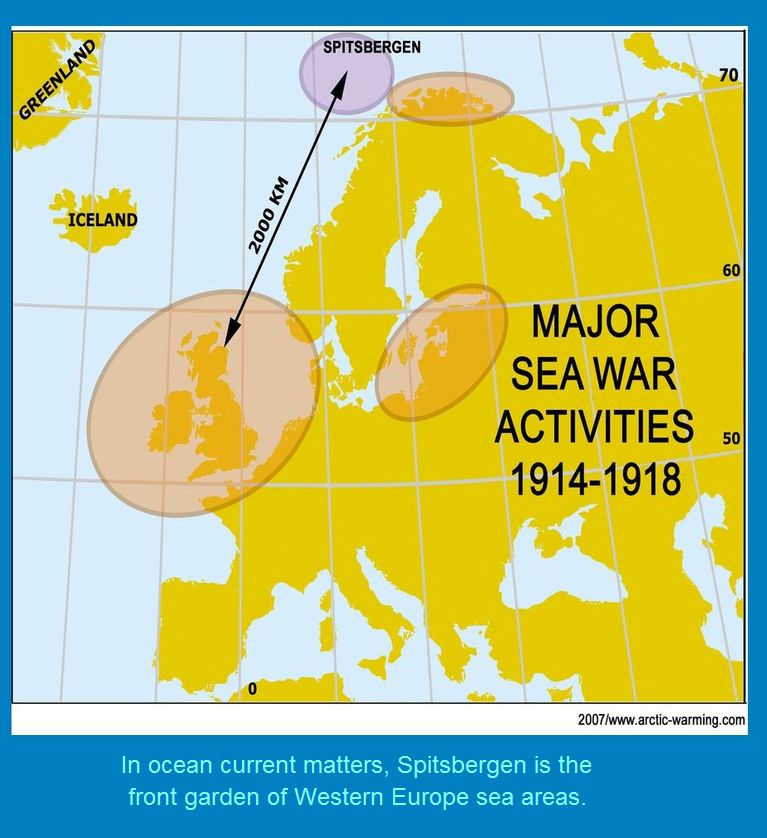


 the atmosphere. This assumption ignores that immediately after any heat intake, the warmed-up water is part of the horizontal and vertical sea current system and furthermore may be pushed down by sea waves (~ 3 Bft.+) or propeller driven vessels (or other human activities) to much greater depths. For example, a hurricane can push water from the sea surface layer down to about 50 meters. From there the water moves on, and the heat may only released back to the atmosphere after several days or many years. In this way international shipping presumably has significantly contributed to the global warming since the late 20th
  Century. Climate models must fail if not feed correspondingly.

 mentioned. As many ten-thousand ships plugged the sea every day, and billion objects exploded and sunk to the bottom
  of the sea, over several dozen meters or few thousand kilometers. Aerial bombs, torpedoes and depth charges proved particularly effective. The photos are self-explanatory. One can only wonder that interest in any human impact on climate by activities at sea hardly exists.


 Post 18 Februray 2017; Continued from: dr-judith-curry-on-climate-sciences-fatal-flaw/ & warm-up-1918-1939-explained-for-dr-judith-curry-and-other/


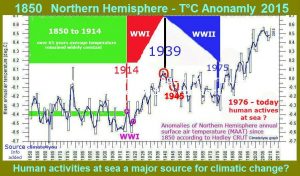 ignorance is irresponsible. Any proof, whether by a minor or high percentage, would ultimately require an indepth research on naval warfare on the global cooling 1940-1970s, and subsequently of merchant shipping and other ocean uses on global warming since 1850, which would quickly stand correctly for ‘AGW’ (anthropogenic global warming).
 Dr. Judith Curry speaks out on climate science’s fatal flaw –
 . In this system the ration between ocean and atmosphere is 1000:3, in regard to average temperature about +4°C to 14°C. The vast dominance of the oceans concerning physical parameters is very obvious. If it is too big to understand, to assess, and to feed into computer models, should not allow speaking instead about ‘natural climate change’. A thorough investigation of the impact of the World Wars on the most pronounced climatic shifts since the end of the Little Ice Age about 170 years ago will demonstrate how easy major human activities – at sea – even over a short period of time may influence weather (and climate).

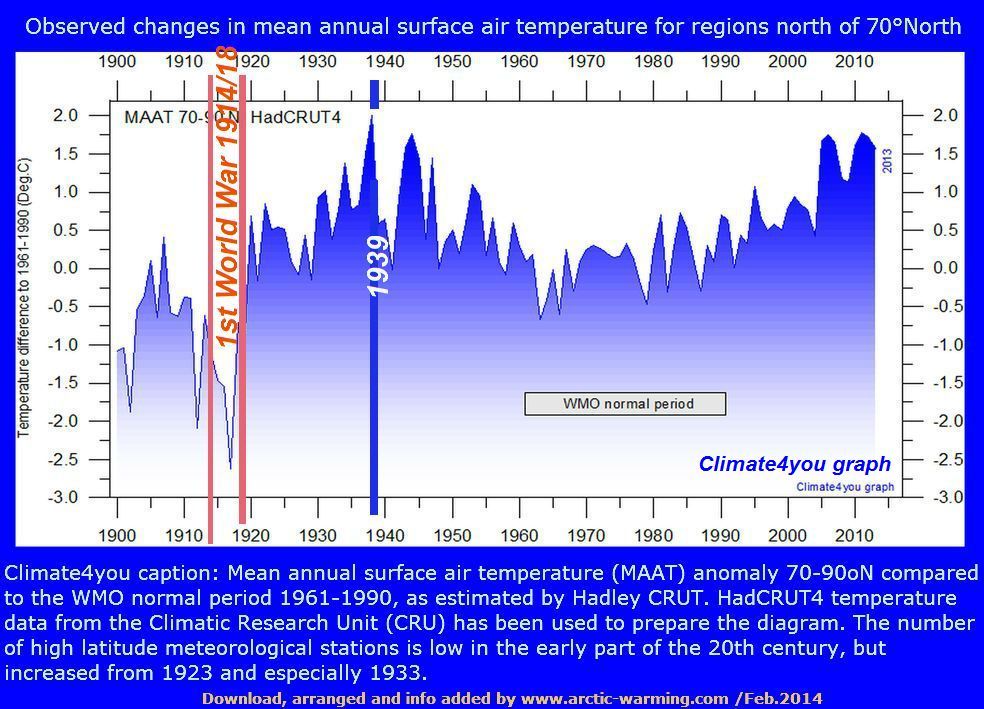


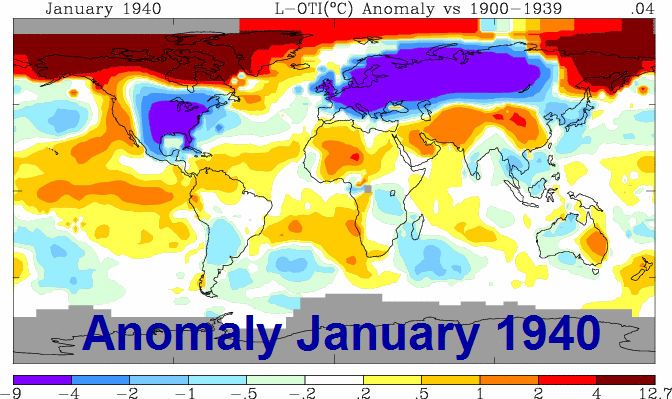


 nd change of current direction; 24 hours a day. Warmer or colder water may reach the sea surface, that inevitable alter the air temperature.
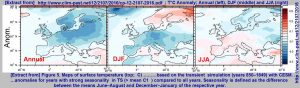 Camenisch and her 32 colleagues in their recent paper (A) concerning a climate reconstruction from a multitude of natural and anthropogenic archives, which indicates that the 1430s were the coldest decade in north-western and central Europe in the 15th century.


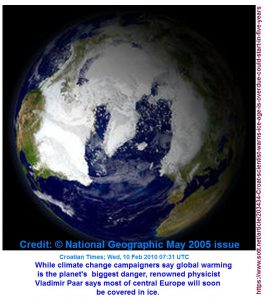 Too many miss the big picture – also Alan Carlin
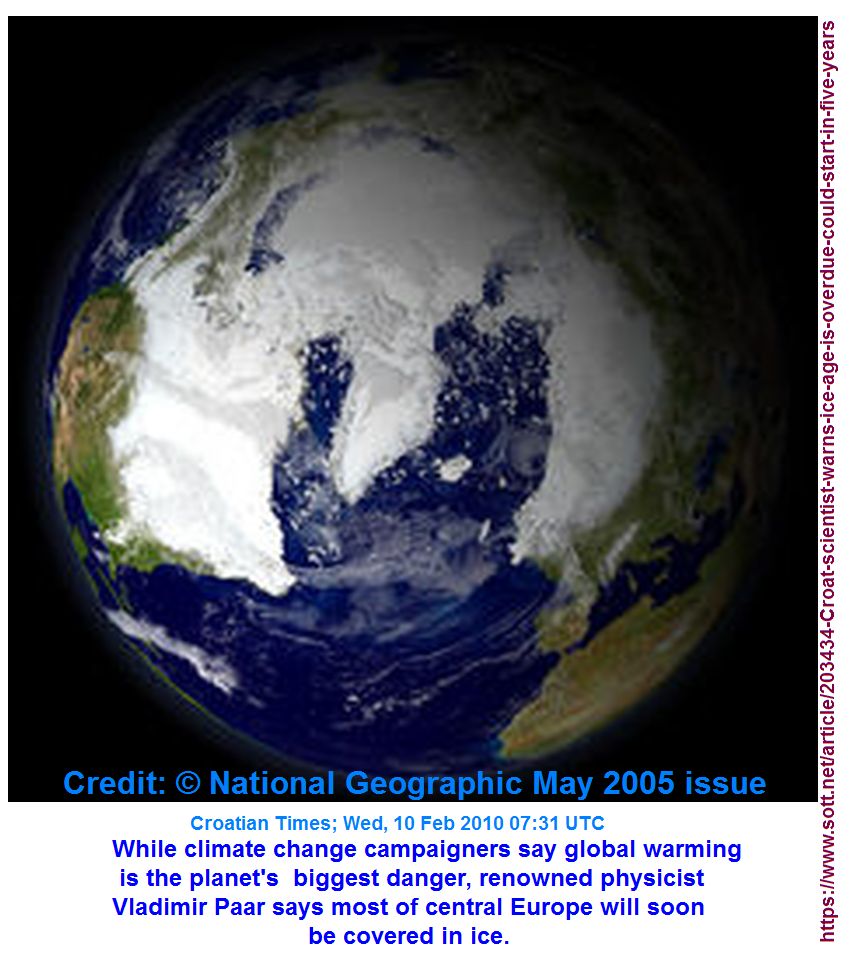
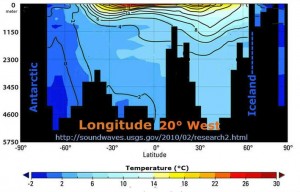
 essment is important, and the essay is recommended to be read due to the fine presentation of the oceanic dimension and temperature structure. But if Röst assume “Warming by [less] Upwelling of Cold Ocean Water”, he is speculating, as no data in this respect have been collected. Even if several ten-thousand devices would be put in place, it would require several dozen decades, before it might be possible to analyze a globally relevant correlation.
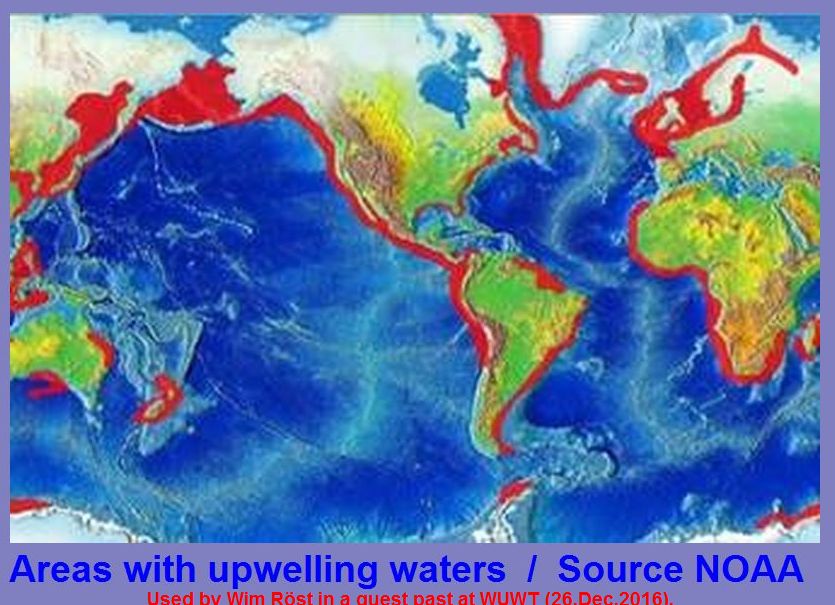
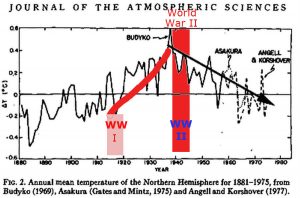


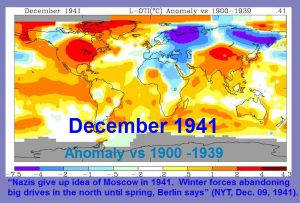

 And again, Hitler’s great field experiment in climate-change by naval war in the seas around Europe showed quick and thorough results. Europe was unexpectedly back in the Little Ice Age. A number of locations got the coldest winter ever recorded. The ‘great commander’ had shot himself in the back. The weather conditions Hitler’s warfare forced to arrive marked the beginning of the end of the Third Reich.
 Arctic Report Card 2016 – An Insufficient Work
 While it is a fact that a persistent warming trend and loss of sea ice trigger Arctic changes, it is necessary to acknowledge that the prime source is the sea water column, which is extreme sensitive to human activities (see image), particularly in those sea areas which are ice covered. But the repot does neither acknowledge this aspect, nor does it offer any information. Instead the “surface air temperature” is in focus and one of the leading scientists Mark Serreze, is quoted: “Personally, I would have to say that this last year has been the most extreme year for the Arctic that I have ever seen. It’s crazy.” Indeed, the report is waste of time and money without details on changes in the water column, and telling the public about any possible impact scientific research and other activities in the Arctic may have on air temperature and sea ice cover.


 This major topic in a world that fears anthropogenic climate change will not be raised during the meeting of Abe with Obama in Pearl Harbor on Dec. 26 and 27. Decades have passed and no lesson learned from the impact of many thousand warship and several ten-thousand air planes involved in dozen of naval activities; bombing, torpedoing, shelling, and ploughing the sea. Any activity penetrated and revolved the sea down to dozen, in many cases down to several hundred meters. Many million objects, vessels, air planes, shells, torpedoes, and so on, sunk to the sea bottom, sometimes over many thousand meters.
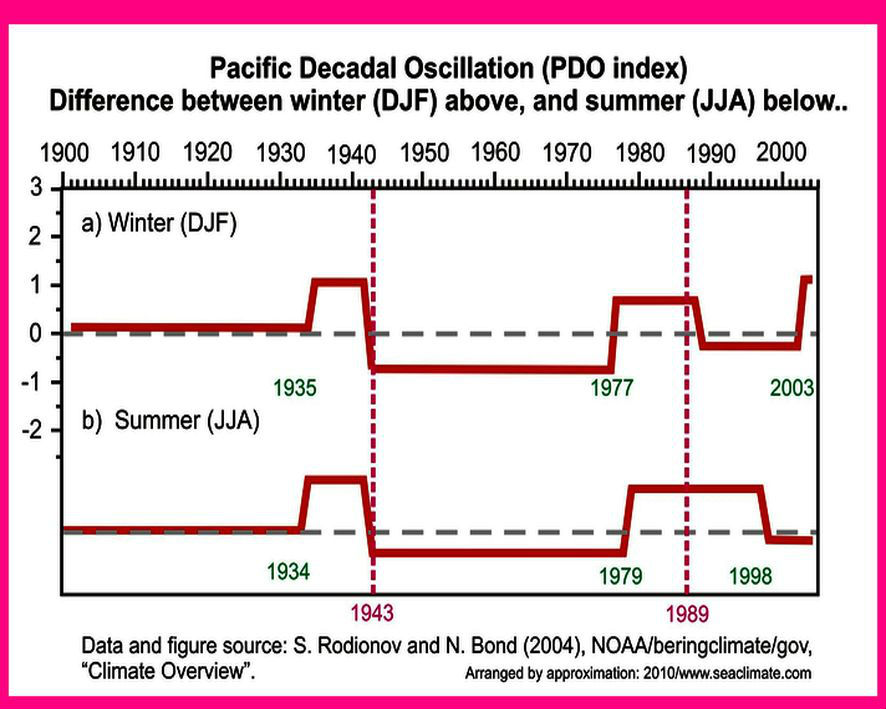
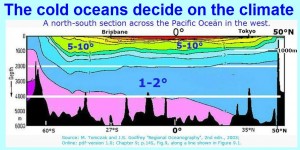 with a physical capacity 1’000 times higher as of the atmosphere. However it is to acknowledge that Dr. Brown realizes that further progress is not possible without more attention to the sea.
 head of the Environmental Protection Agency (EPA). The pick of the Oklahoma Attorney General has been described as “putting an arsonist in charge of fighting fires”, with some warning “the whole country is in danger”, even an “existential threat to the planet”.


 Holy Molly what is Rep Senator Jim Inhofe going to say, who calls Climate change talking the “Greatest Hoax”, confirming this assessment in a statement only one month ago: “Americans do not support …economically damaging mandates that have no measurable impact to climate change.” (More HERE) That hardly fits together. On one side a man who once said that “the world had until 27th January 2016 to end its addiction to fossil fuels or it would come to an end; and on the other hand someone who promises to “make America great again”. How those shall work, and worst if based on a far too narrow knowledge base – as outlined in the pervious post.
 our best and brightest through the doors of Trump Tower to constructively engage him”.
 and that this decade is characterised by cold winters and average to warm summers”. No surprise that WUWT titled the story: “Cold Kills: The coldest decade of the millennium”, but merely asking: “cold kills, so why all the whining about warming?”(B), while remaining silent about the papers notion, that “…these conditions occurred by chance due to the partly chaotic internal variability within the climate system”. This is shocking. What is “internal variability”?
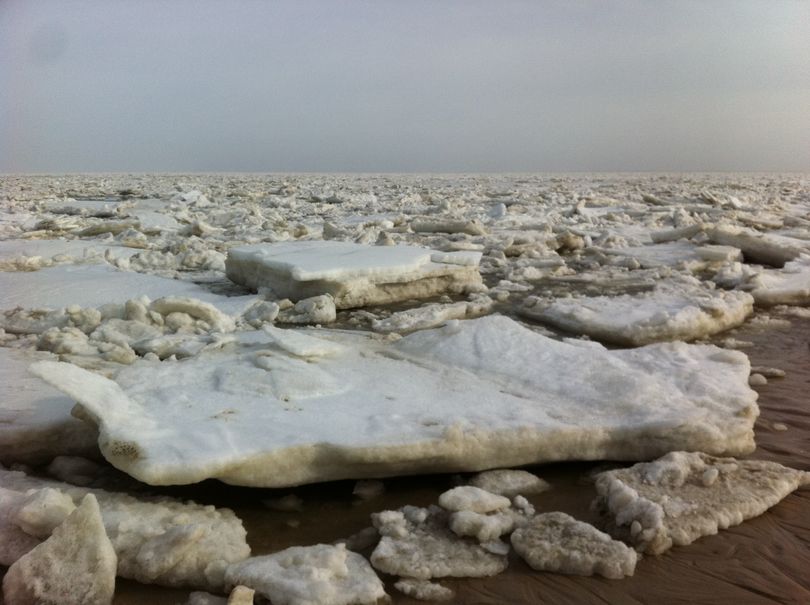

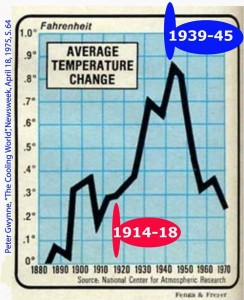 Oceans and seas are very complex, which are not well-understood not even today. But war at sea during two major world wars was a tremendous force that has left its trace on the oceans. Two climate changes during the last century prove our thesis. Winter temperature had risen in Spitsbergen with 8ºC (1918–1939). The whole Europe got warmer every year. The German Chancellor Adolph Hitler started the war in 1939 and immediately North Europe was dragged back into the Little Ice Age, which implied climatic conditions not experienced for over 100 years. Two arctic war winters followed in the region with extreme naval activities until the war at sea went global, in 1942. And what followed immediately after that? There were four decades of global cooling, affecting particularly the Northern Hemisphere, because here naval war had the most devastating effects and left a definite fingerprint in the downturn of global temperatures. Even though our book section on naval warfare between 1942 and 1945 is short, the connection between naval forces and global cooling is overwhelmingly convincing.
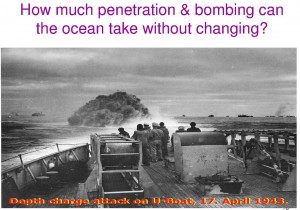
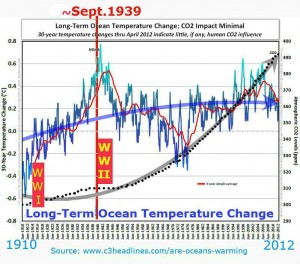 warming must implicitly be able to explain a pronounced global cooling which affected the climate only half a century ago. Ignoring the event for more than six decades is even more bizarre than relating phenomena to a ‘higher power’.
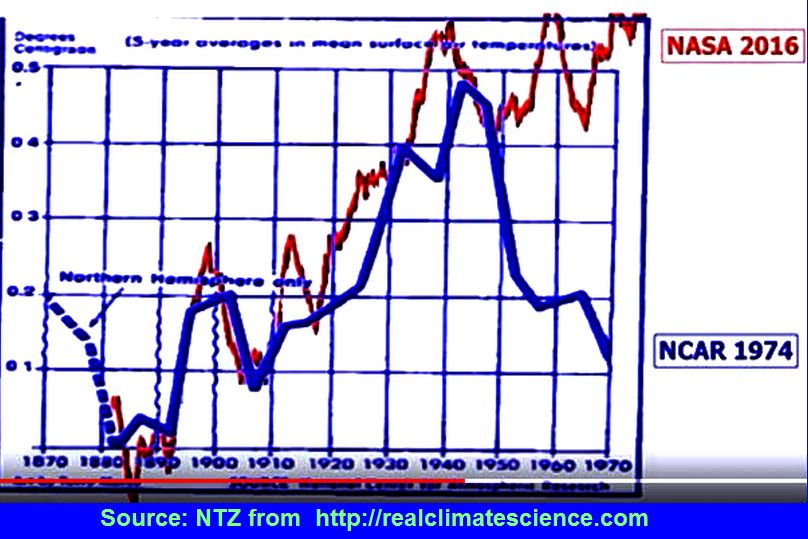

 that alternate with La Niña patterns, impacting on global climate over the last 2000 years. What does it tell us? Oceans govern climate! The sea surface area of an El Niño event is extreme small compared with the entire global ocean space. How shall such tiny sea area contribute significantly to global warming, asks a recent post?. The ocean interior is what matters. No surprise that the lead author Dr Michael Griffiths from William Paterson University /USA explains: “Until we can model this lower-frequency behavior in the tropical Pacific, one can only speculate on how the warming will play out over the next few decades”. Unfortunate this view is by far too narrow. Reducing such issue on the ‘tropical Pacific’ is appalling naïve. All ocean space from top to the bottom (3’500 meters), contributes to climate change. This inability to see the entire picture on what governs climate is the real threat to the world fearing climate change. .
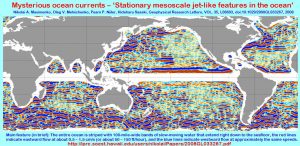 activities.” (1) The Guardian is even blunter: “It’s settled: 90–100% of climate experts agree on human-caused global warming” (2) It looks compelling, but not everyone agrees. “..[t]he claim of “scientific consensus” on the causes and consequences of climate change is without merit”, object the authors Craig D. Idso et al., in a recent book publication by The Heartland Institute (3) Is one claim better than the other. No, because the problem is not “scientific consent”, but the facts used for consideration.
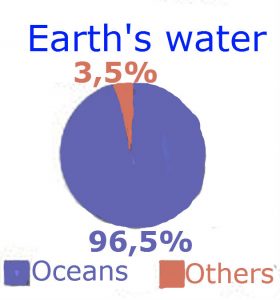 transported over land and falls as precipitation. Once evaporated, a water molecule spends about 10 days in the air. That means a replace of about 50 times per year. The volume of water in the atmosphere at any one time is about 12,900 cubic kilometers (km3), which is about 0.001 percent of the total Earth’s water volume (Volume of the Baltic Sea 21,700 km3).
 they are likely to be in focus themselves soon. Only few days ago U.S. Attorney General Loretta Lynch acknowledged
 establishing a consensus is about the last thing on peoples’ minds”, which he base on study evolutionary biology. He thereon explains “that under these conditions, as often as not, a leading idea is a target to take aim at rather than a flag to rally ‘round.” From this perspective Rick Wallace concludes: “Obviously, this cast of mind is utterly different from what we find in the AGW arena. Which in itself is compelling evidence that the motivations are different in normal science and in (C)AGW.”
 Modest means modest! Modest with regard to the sun means only a third place or less in CLIMATE CHANGE matters! Skeptics like to challenge main-stream science on the influence of the sun, HERE & HERE referring to “….spectral analysis […over the last ~ 9400 years] identifies a number of distinct periodicities/cycles such as 88 yr, 104 yr, 150 yr, 208 yr, 506 yr, 1000 yr, and 2200 yr…”. That is hardly to dispute, but still wrong with regard to the claim that “the sun has always had an important influence upon climate change”. The sun’s influence is ocean controlled: Variation in solar activity is reflected in cycles. But temporary temperature variations, have little to do with “climate change”, as e.g. “solar activity appears to have remained relatively stable since the 1700s”, assumes a recent investigation. On short term volcanos, on long term oceans change climate, but claiming that there are also “other natural climate drivers” is nonsense. It’s is all physics. There is no evidence that varying sun-ray has ever caused a significant and abrupt climatic change during several hundred-thousand years. REF-1 , REF-2


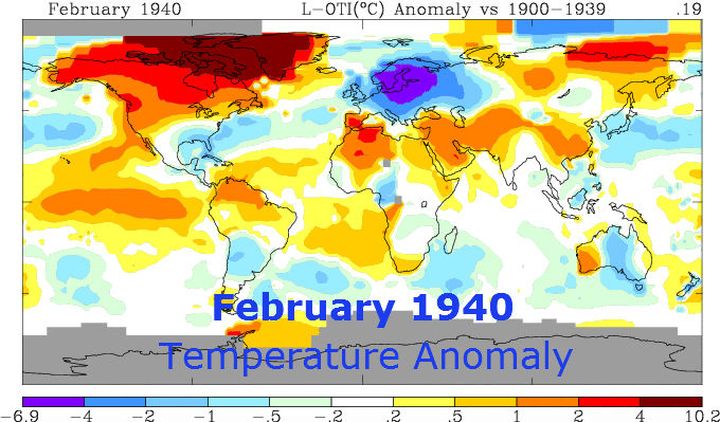

 Command of the Wehrmacht had no idea of the risks, neither did their professional advisers. Meteorology failed then and over all decades ever since. Meteorology is still unable to explain what happened seven decades ago, and the few who did, presents unproven claims, as e.g. Professor Stefan Brönnimann assuming a correlation to an El Nino event. Current El Nino winter 2015/16 proves: it as nonsense. MORE
 Adolf Hitler’s personal responsibility, for weather and climate modification in winter 1939/40 and beyond, was never raised. That is irresponsible and a great failure of Meteorology and Climatology.

 When will climate science be able to distinguish clearly between a global-average manifestation of El Niño-driven global weather effects, and
  an explanation of global average warming associated with El Niño? Concerning the latter aspect the World Meteorology Organization seems not able and willing to do the simplest considerations (Hottest Year). The feature is about a temporary warmer than normal SSTs across the central and eastern equatorial Pacific (ENSO), which looks like one water bubble or pool. Compared to ocean dimension it is merely “a drop in the sea”, and only a tiny fraction warmer than usual, namely about 0,5 to 3°C, with a little dip down to a depth of 100 meters (max 150m), whereas the mean Pacific depth is 4,280 m. Any rough calculation shows that there is not much El Niño can offer to heat the world and contribute to global warming. The water volume is not more than about 0,06% of the Pacific volume, and the ENSO area with higher than +3°C
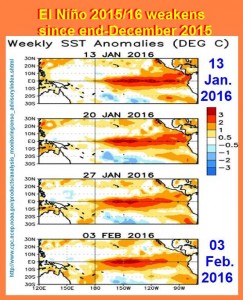 of average may possibly account for about 0,10% (Further details here). All oceans and seas contribute permanently heat to the atmosphere. El Nino is negligible in this respect. WMO should undertake more competent considerations, and talk less empty stuff.


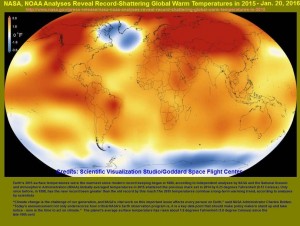 adjusted, and adjusted over several decades. For 2015 NOAA presents a wonderful image, presumably more art than science, with a tiny cold hole between Iceland and Canada. The ‘glowing globe with a blue eye’ is based on global average temperature difference to the period of 1951 to 1980. That is gross negligent if not scam. The 1930s ended with almost as high temperatures as during the last decade with the years 1934, 1931, 1938, 1939 in the top league of hottest years since the end of the Little Ice Age about 1850. In late 1939 World
  War II commenced. Four month later the winter in Europe was the coldest for 100 years (more HERE and HERE) and subsequently global temperature broke down for decades, recovering only in the 1980s. What a disaster, if science has one day to admit that it was WWII.

 together. But not for met-services preferring to make forecast in the distant future.
 system and were highlighted in a recent Met Office research news article (September 2015).


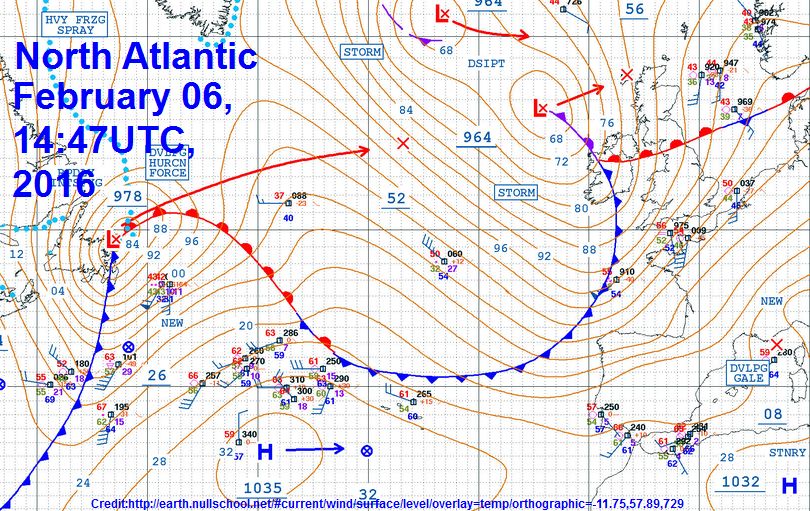

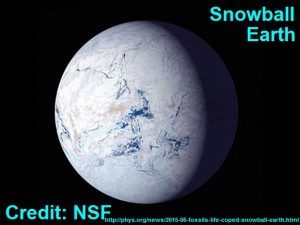 Undersea volcanic eruption has caused a Snowball Earth long ago. Recent papers (HERE, HERE) and blogs
  WUWT, CLIMATE-ETC, ICEAGENOW showed interest concerning the impact on ocean warming, CO2 increase, and climate change. The problem is different: It could trigger a new ice age within a short period of time. The ocean is too big to reflect pronounced on a bit heat input, but may alter oceanic currents. Major changes in the global flow system would affect the sea surface. Overall ocean temperature is about 4° Celsius. The warm sea surface with more than 10°C is a very thin layer north and south of the Equator. Cooling the upper surface layer down by a few degrees Celsius could be sufficient to trigger new ice age. Mankind may have only a few months to lament about the good time of “global warming”, as the chance to alter the trend is nil, and
  a Snowball Earth would end further commenting pretty soon.


 publication:
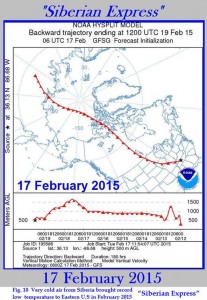 water in the summer season and rises to the surface from lower layers in the winter period, where heat is exchanged with the air until sea icing is observed. This is a process that can be seen from the beginning of September until the end of March.
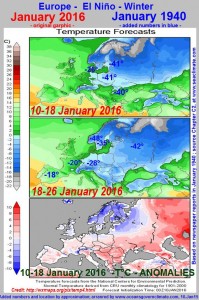 mid-1970s. After the end of 70 years copyright barrier, Hitler’s ‘Mein Kampf’ is back in print, a book full of hate, lies, and stupid conclusions, written between 1924 and 1926. He is better known as the greatest war monger of all time, but due to failure of meteorology and climate science, was never identified as the first and worst individual who caused climate change, and called a “criminal in climate change matters”. Adolf Hitler started WWII on 1st September 1939 and only four months later Europe tumbled into the coldest winter in more than 100 years. By mid-January 1940 temperatures fell to minus 40°C at many locations from Leningrad/St. Petersburg to Sofia, with an all-time cold record in Poland. For more details see January 1940 Temp-Map. The coldness continued until the end of February 1940. But science does not know.
 reported BBC on January, Monday, 04. . Meteorology Services underline such incompetent reporting, e.g. weather.com, instead of informing the general public that 76 years ago air temperature plugged to record lows before mid-January 1940, as reported by the New York times; 08. Jan: minus 35°C in Northern and Central Russia, and on the 11th: Romania -40°; Riga -41°; Vienna -26° Sofia; and at Siedlce in Poland minus 41° the all-time record (see map; Source). Although also a strong El Nino year, the difference between January 2016 and 1940 is tremendous, because Europe was in the fifth month of World War II, that altered the status of the reginal seas so much, that the cold snap in early January 1940 was only the beginning of more worst to come. The prospect this January is very different as indicated in the attached graphic. See for entire month January 1939 versus 2016 previous post: https://oceansgovernclimate.com/storm-frank-el-nino-insufficient-explanation/
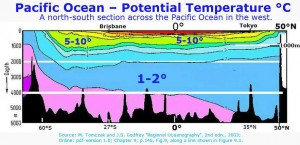 that could threaten the survival of civilization.
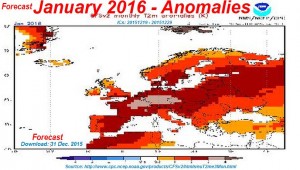 Climate alarmists have run wild with predictions about the Monster El Niño active in the Pacific for several
 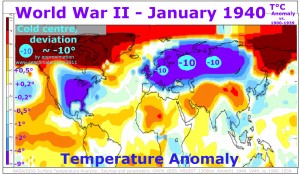 months (MORE). A corresponding situation existed in late 1939. But between the temperatures January 1940 and assumed January 2016 the difference could not be bigger. Don’t ask meteorology to explain. 76 years have passed without ever been interested in the matter.
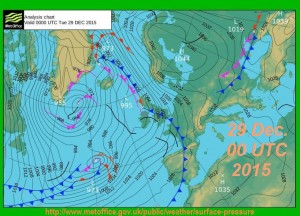 The recent run of unsettled, wet weather will continue this week with Storm Frank (MetOff-29Dec15), the sixth named storm of the season
  arrives. December has already been a record breaking month for rainfall in some parts of the UK, with exceptional amounts of rain falling onto already saturated ground (28Dec- HERE). Wet weather will continue. Storm Frank (955 hPa) south-east of Greenland Tuesday morning is on the way (29 Dec) –Fig 1 (left)–


 northern continental Europe is linked to the strongest El Niño ever recorded, causing unusual weather from Britain to Australia, reports The Guardian (Dec.20, 2015): “What we are experiencing is typical of an early winter El Niño effect,” said Adam Scaife, head of Met Office long- range forecasting.

 _ Icing emerged on river Elbe on the 16th of December 1939, intensified massively before month end, and continued with extreme sea ice conditions for 90 days –throughout the regional seas- until mid-March 1940.

 Since 2011 a new satellite system collects data on long-term climate change and short-term weather conditions. Once and a while it produce nice pictures, as recently, when damaging heavy rains fell on South Carolina in the southeastern United States at the beginning of October 2015. Much of that water had, by mid-October, flowed into the Atlantic. The image, a Visible Infrared Imaging Radiometer Suite (VIIRS), shows the runoff as it interacts with ocean currents on Oct. 15. Climatologists use VIIRS data to improve our understanding of global climate change (Source).
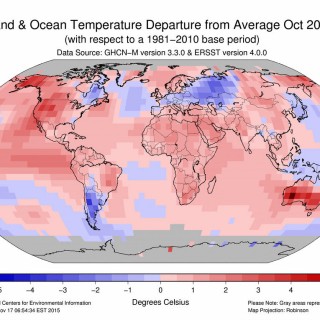 Prof. H.J. Schellnhuber’s 784-page epos ‘Self-immolation’ (2015), just published in time for COP21, commencing in Paris today, is a masterpiece piece of missionary work – for doom mongers.
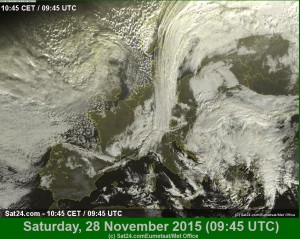 science used as the basis for the conference is a creation of corrupted people who hide behind rules created for a completely different purpose”, is the verdict of Tim Ball [at WUWT – 27 Nov. 2015].
 anthropogenic climate change are of great importance (climate change is ubiquitous in history). But the news increasingly describes normal weather as a kind of plague, something to fear.


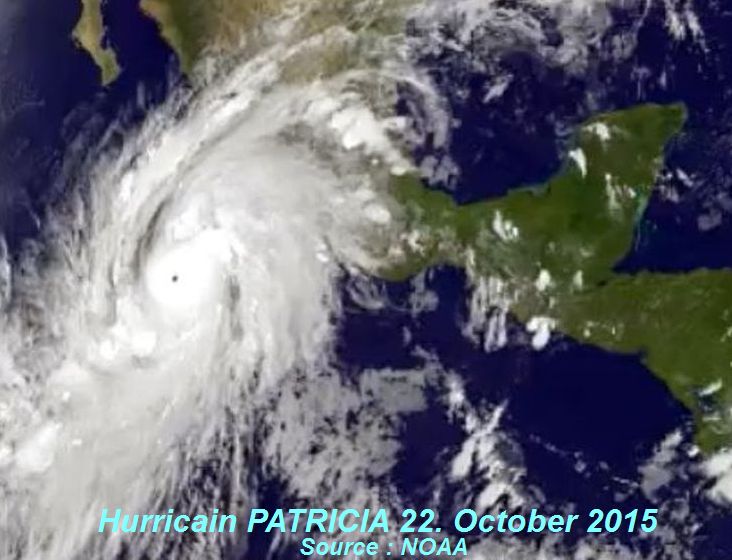

 of the AMO*) can be accounted for by atmospheric circulation alone, without any role for the ocean circulation.


 Science has not yet explained why Norther Europe warms more than the rest of the world (REF.) Any impact of ocean use has not crossed their mind. Today further 80 offshore wind turbines north of Rügen start-up, at a location which is between 23 to 40m deep. Over the seasons the temperature difference between top and bottom can reach more than 12°C and differ between various depths level and throughout the season. As the water masses of the Baltic is in move permanently, inevitable any kind of platform forms a considerable obstacle, forcing the “natural current” to change course. During summer that will force more heat in, and in winter more heat out. Regional air temperature is likely to increase. This is a very simple process to recognize. Too difficult for science to understand and investigate?


 Europe. California experienced an eight days heat wave, since about 16th September followed by a severe tropical storm New York Times
 (click on picture to enlarge)


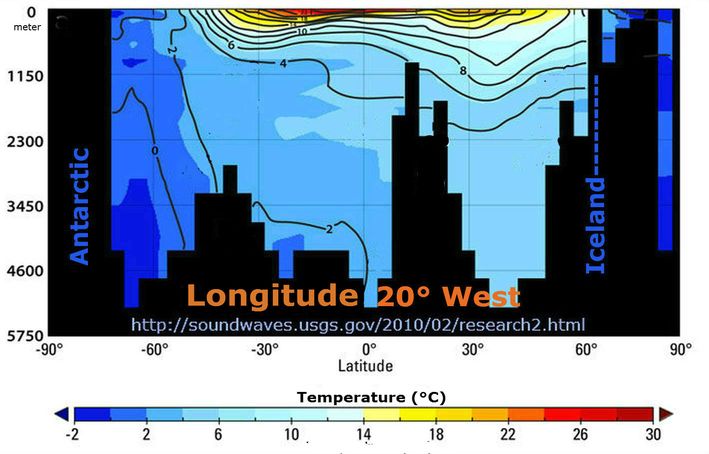


Recent Comments